
29 March 2023
This Power BI how-to article is brought to you by JBI Training, the UK's leading technology training provider.
Introduction:
Businesses of all sizes need to closely monitor and analyze their sales performance to make informed decisions and stay ahead in the competitive market. Microsoft Power BI offers an array of powerful tools and functions to help organizations transform raw data into meaningful insights. One such valuable function is the Group By feature in Power Query Editor, which enables users to aggregate and summarize data based on specific criteria.
In this tutorial, we will walk you through the step-by-step process of creating a sales performance analysis report using Power BI's Group By function. We will group the data by Region and Product Category, allowing you to identify high-performing areas and products. This actionable information will empower your organization to allocate resources more effectively, optimize marketing efforts, and ultimately boost sales performance.
How To Step-By-Step:
To create a Power BI report for Sales Performance Analysis, you'll need to use the Group By function in the Power Query Editor. Here's a step-by-step guide for creating a grouped table based on Region and Product Category:
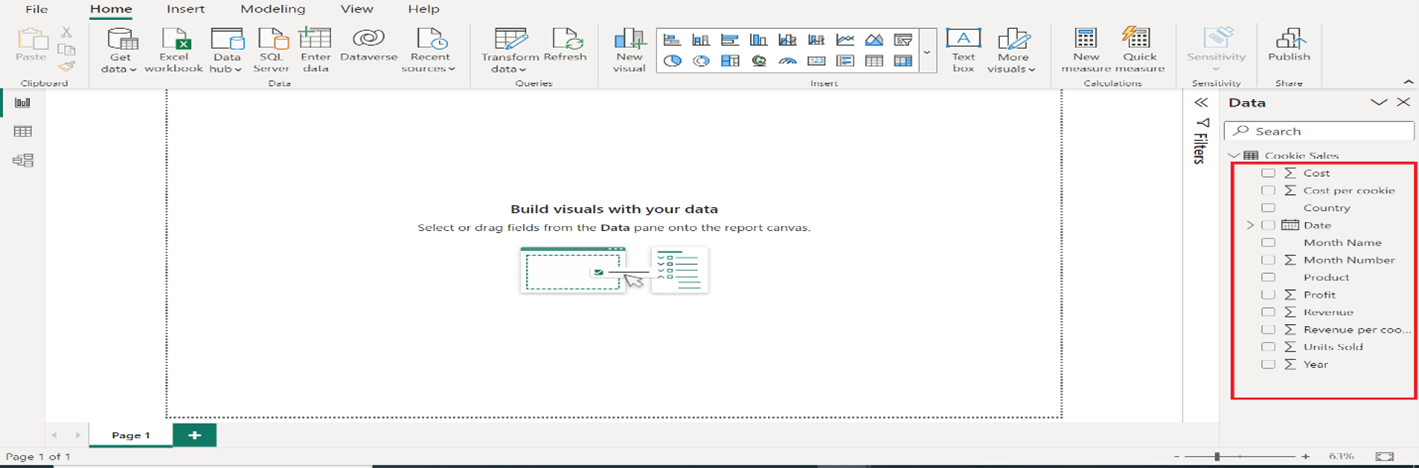
1. Load your data into Power BI. For this example, let's assume your data source contains the following columns: Country, Product Category, Product, Units sold, and Revenue.
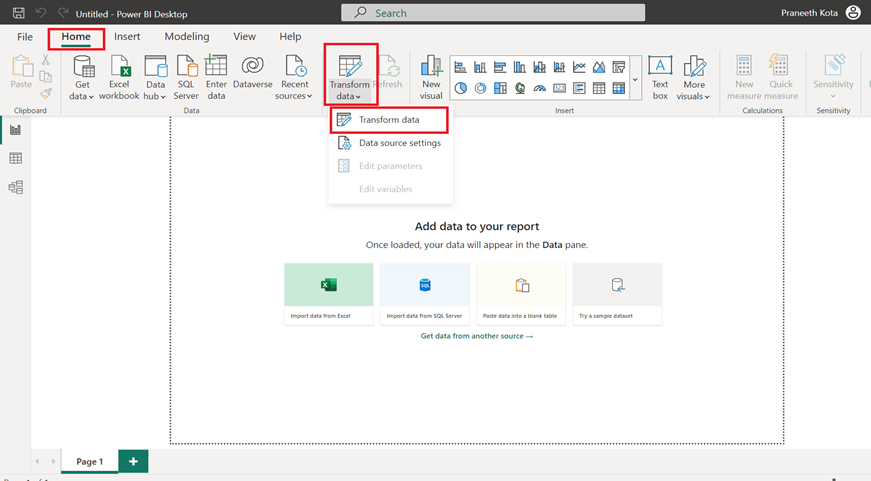
2. Click "Home" > "Edit Queries" to open the Power Query Editor.
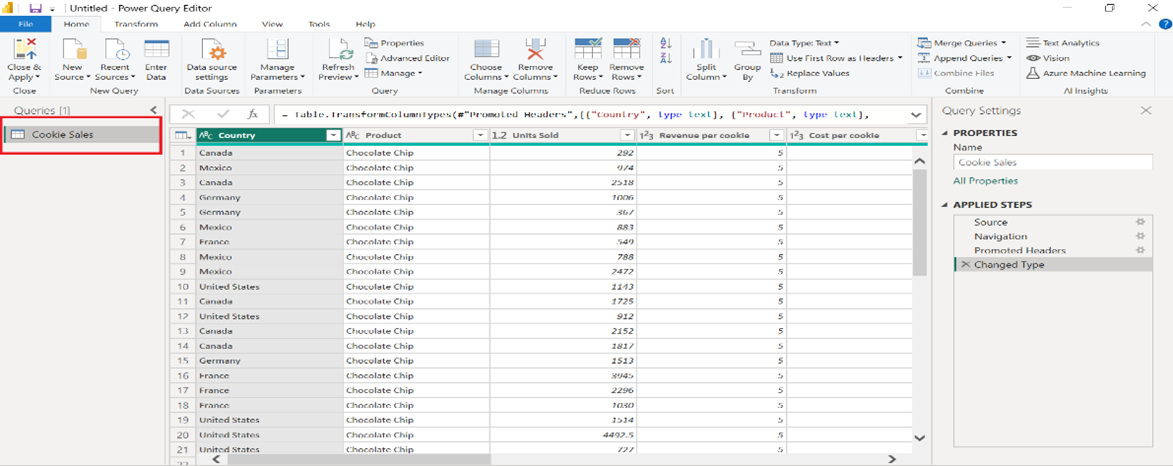
3. In the Power Query Editor, select your data table in the left pane.
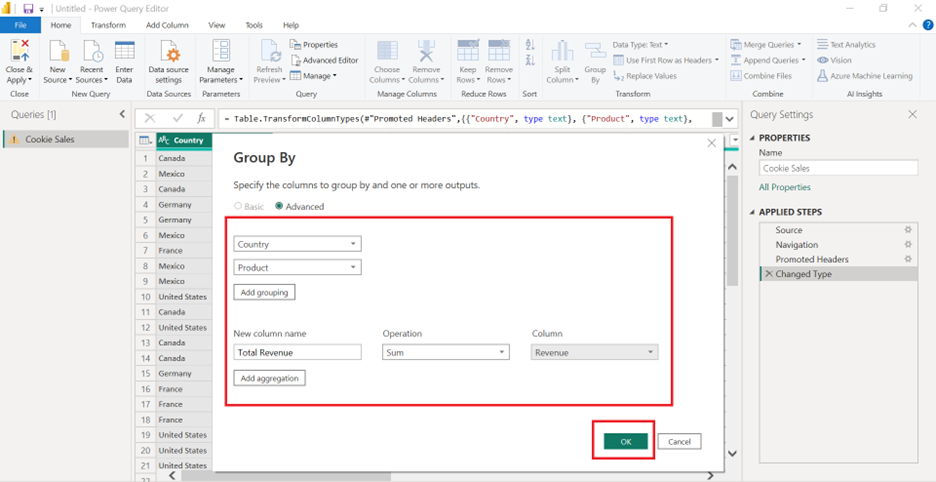
4. In the "Home" tab, click "Group By" in the "Transform" group.
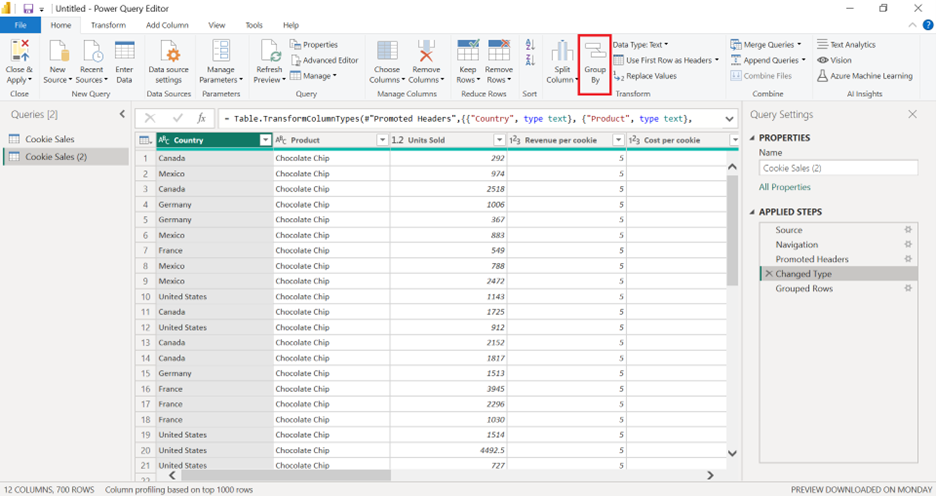
5. In the "Group By" window, set up the following:
6. Click "OK" to apply the Group By function.
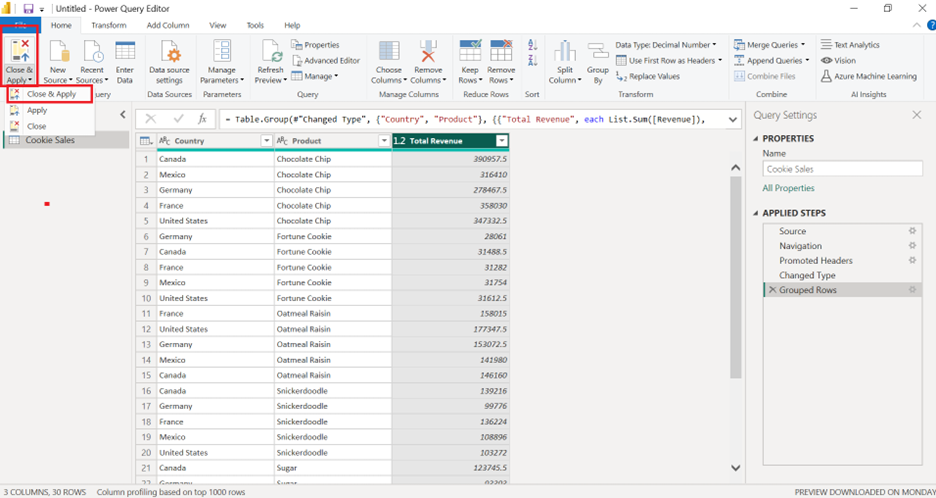
Now you have a new table that displays the total revenue for each combination of Region and Product Category. To visualize this data in a more meaningful way, you can create a Matrix, Bar chart, or Pie chart in Power BI.
1. Close the Power Query Editor by clicking "Home" > "Close & Apply.
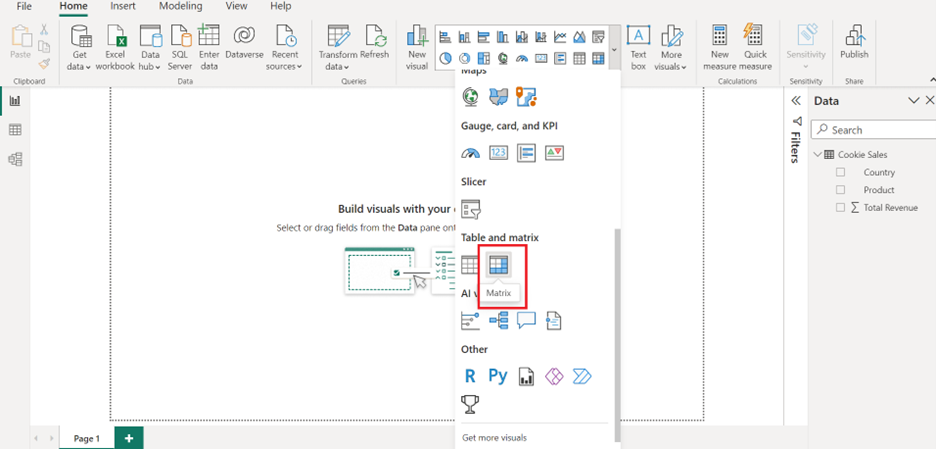
2. In the Power BI report view, click on the "Matrix" visual from the "Visualizations" pane
3. Drag the "Country" field to the "Rows" section, the "Product" field to the "Columns" section, and the "Total Revenue" field to the "Values" section of the visual.
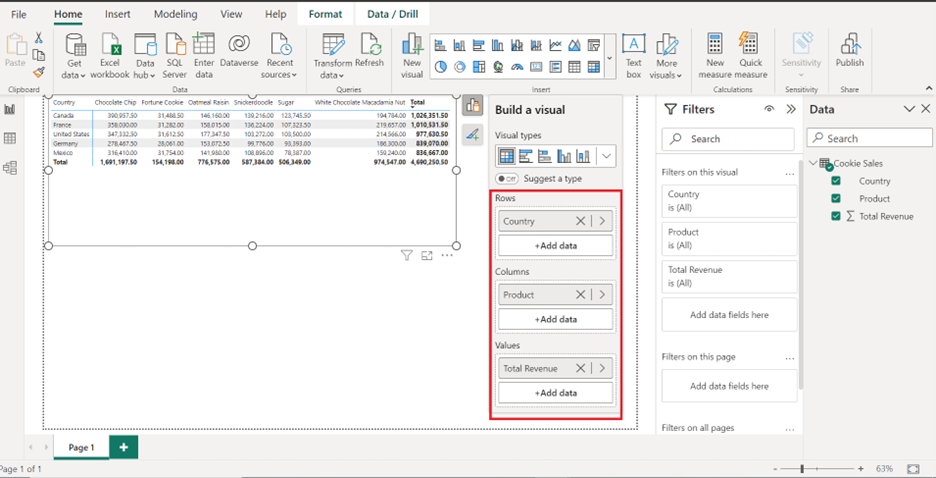
You now have a matrix that shows the total revenue for each region and product
Conclusion:
Mastering the Group By function in Power BI can significantly enhance your organization's ability to analyze sales performance and identify growth opportunities. By following this step-by-step guide, you have successfully created a sales performance report that displays total revenue for each combination of Region and Product Category.
This valuable insight will help drive data-driven decisions and boost your business performance.
We hope you found this step-by-step guide on Power BI’s incremental refresh feature insightful and valuable.
As you continue to explore the powerful features of Power BI, it's crucial to expand your knowledge and skills to take full advantage of its capabilities.
We highly recommend reading our next article, "Power BI Workspace: A Comprehensive Guide" where we will explore the concept of Power BI workspaces, learn how to create and manage them and discuss some best practices to make the most of this versatile feature.

CONTACT
+44 (0)20 8446 7555

Copyright © 2023 JBI Training. All Rights Reserved.
JB International Training Ltd - Company Registration Number: 08458005
Registered Address: Wohl Enterprise Hub, 2B Redbourne Avenue, London, N3 2BS
Modern Slavery Statement & Corporate Policies | Terms & Conditions | Contact Us


