CUSTOMISED
Expert-led training for your team
Dismiss
Power BI Tips - Group by

29 March 2023

Using Group By in Power Query while Retaining All Columns -  A How-To Guide

This Power BI tutorial is brought to you by JBI Training, the UK's leading technology training provider. 

When using Power Query in Power BI to clean and transform your data, you may want to group your data by a specific column while keeping all the other columns in the resulting table. In this how-to guide, we will explain how to use the Group By function in Power Query while retaining all columns in the dataset.

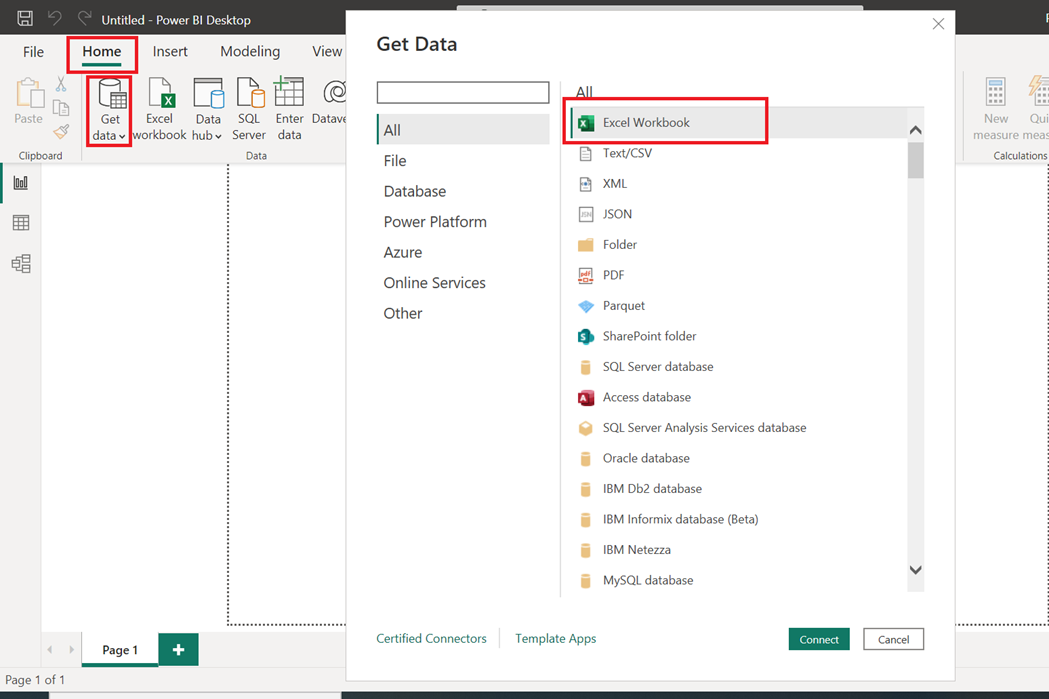
1. Load your data into Power BI:

Open Power BI Desktop and import your data by clicking on the "Home" tab, then select "Get Data" and choose the appropriate data source.

Using Group By in Power Query while Retaining All Column

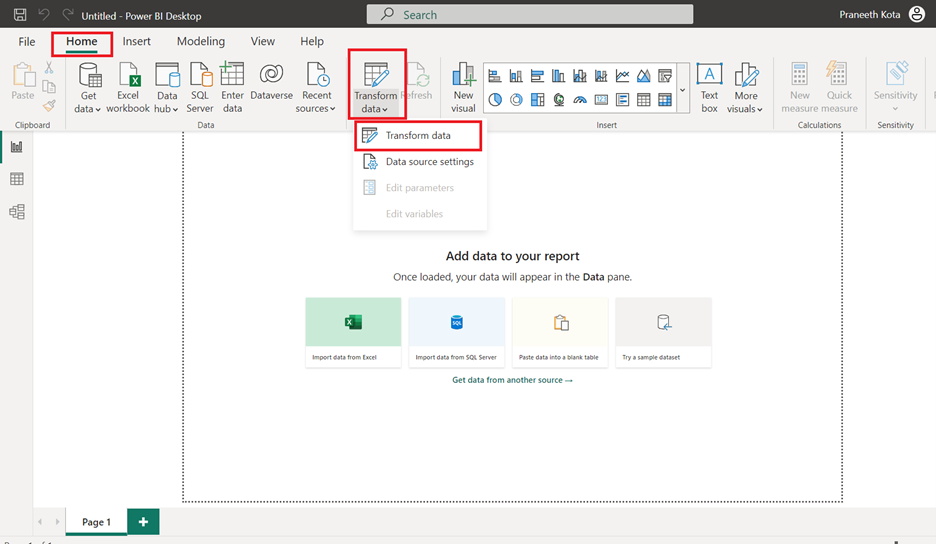
2. Open Power Query Editor:

Once your data is loaded, click on the "Transform Data" button in the Home tab to open the Power Query Editor.

Using Group By in Power Query while Retaining All Column

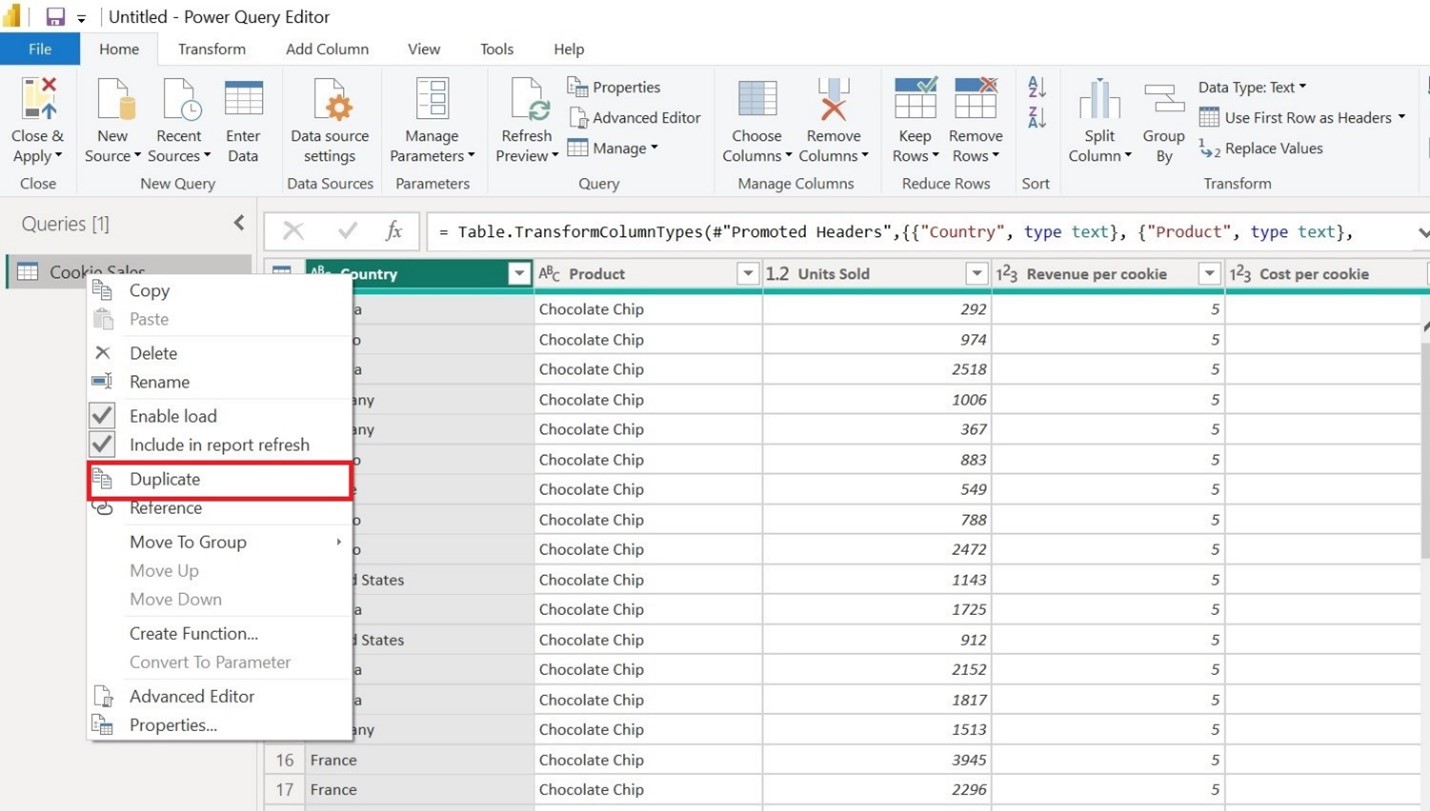
3. Duplicate the column you want to group by:

To retain all columns in the grouped data, start by duplicating the column you want to group by:

  1. Right-click on the column header.
  2. Select "Duplicate Column" from the context menu.

Using Group By in Power Query while Retaining All Column

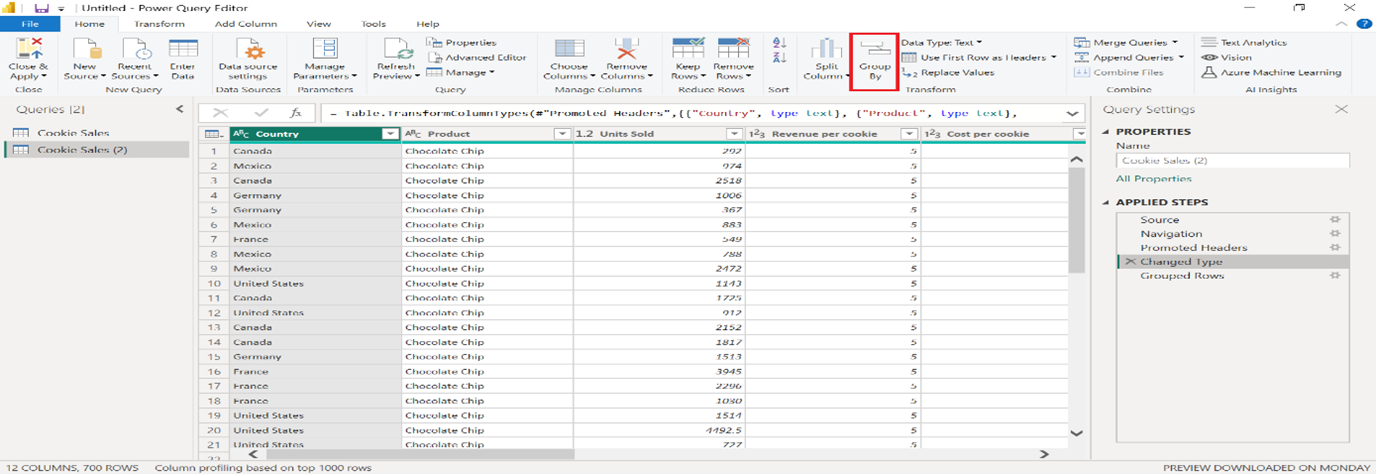
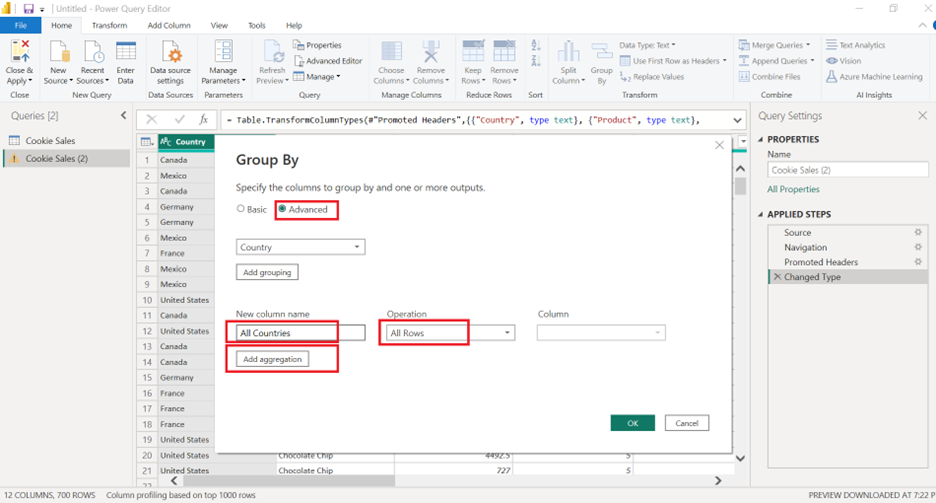
4. Group by the duplicated column:

Now, group your data based on the duplicated column:

  1. Click on the duplicated column header to select it.
  2. In the "Home" tab of the Power Query Editor, click on the "Group By" button.
  3. In the Group By the window, select the aggregation function you want to apply to the data, such as Sum, Count, or Average.
  4. Choose the column you want to perform the aggregation on from the "New Column Name" dropdown menu.
  5. Click "OK" to apply the Group By operation.

Using Group By in Power Query while Retaining All Column

Using Group By in Power Query while Retaining All Column

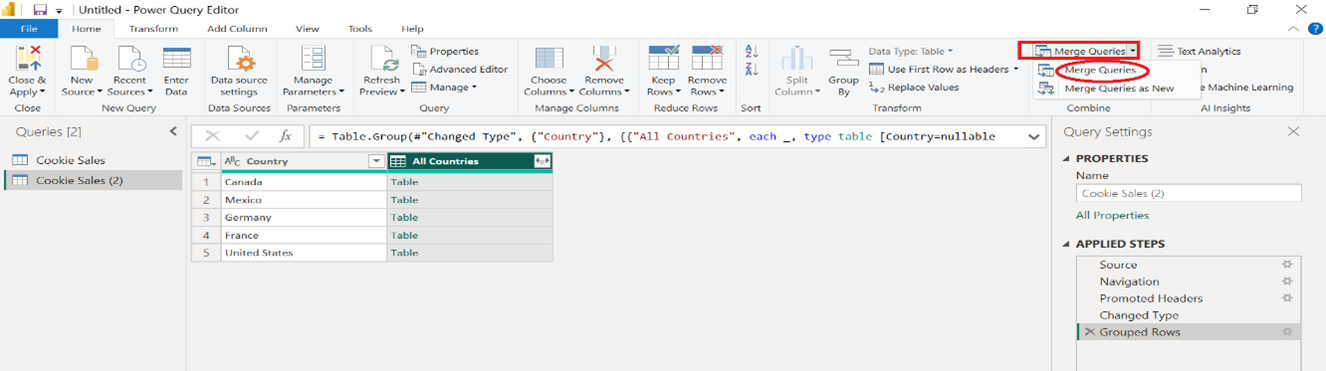
5. Merge the original and grouped tables:

To retain all columns in the final result, merge the original table with the grouped table:

  1. Go to the "Home" tab and click on the "Merge Queries" button.
  2. In the Merge window, select the original table as the first table, and the grouped table as the second table.
  3. Click on the original grouping column in the first table and the duplicated column in the second table to establish a matching relationship.
  4. Choose the "Left Outer" join type to keep all rows from the first table and matching rows from the second table.
  5. Click "OK" to merge the tables.

Using Group By in Power Query while Retaining All Column

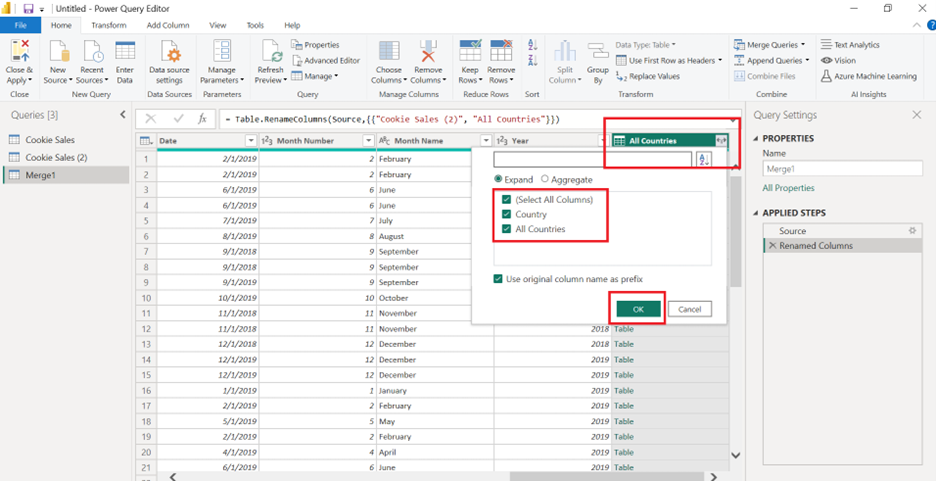
6. Expand the merged table:

After merging the tables, expand the new merged column to include the aggregated data:

  1. Click on the expand button (two arrows) in the merged column header.
  2. In the "Expand" window, uncheck "Use original column name as prefix" and select the columns you want to include in the final table.
  3. Click "OK" to expand the column.

Using Group By in Power Query while Retaining All Column

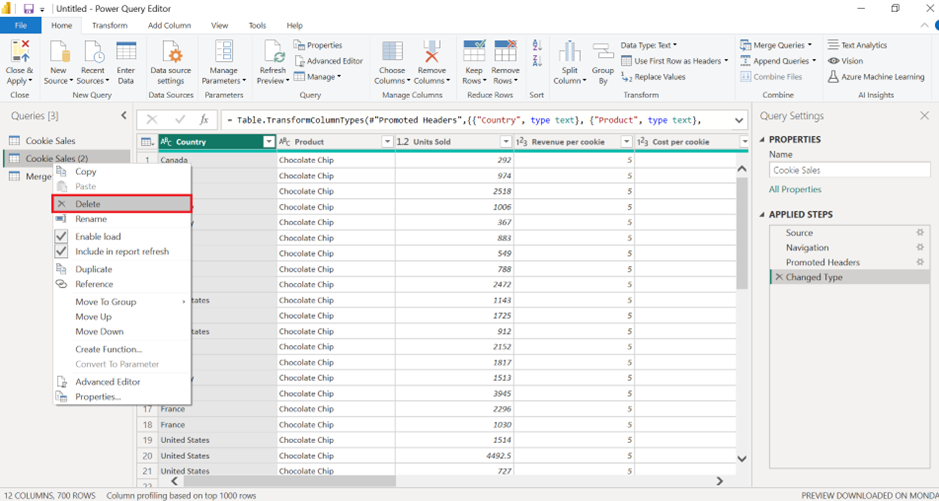
7. Remove the duplicated column:

Finally, remove the duplicated column used for grouping:

  1. Right-click on the duplicated column header.
  2. Select "Remove" from the context menu.

Using Group By in Power Query while Retaining All Column

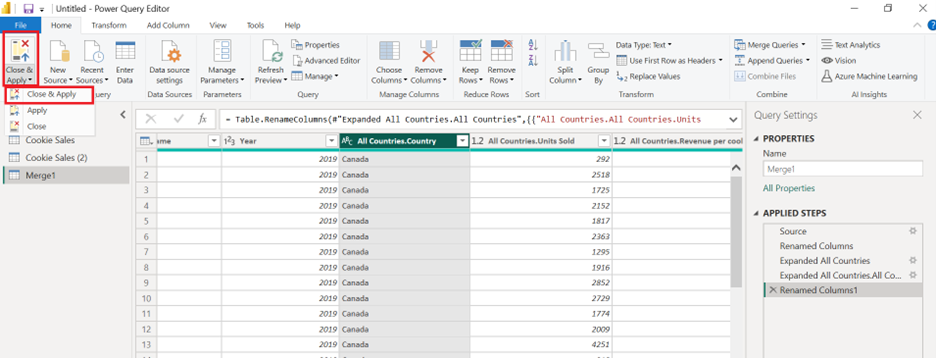
8. Apply and close Power Query Editor:

After completing these steps, click "Close & Apply" in the Home tab of the Power Query Editor to apply the transformations and return to the main Power BI window.

Using Group By in Power Query while Retaining All Column

Conclusion:

By following these steps, you can use the Group By function in Power Query while retaining all columns in your dataset. This method allows you to aggregate your data based on a specific column and keep all the other columns in the resulting table, providing a more comprehensive view of your data for further analysis and visualization.

We hope you found this step-by-step guide on Power BI’s incremental refresh feature insightful and valuable. 

NEXT ARTICLE

As you continue to explore the powerful features of Power BI, it's crucial to expand your knowledge and skills to take full advantage of its capabilities.

We highly recommend reading our next how-to article, "Customizing X-Axis Order in Power BI" where we delve into the X-axis in visuals to create meaningful and easy-to-understand reports.

About the author: Craig Hartzel
Craig is a self-confessed geek who loves to play with and write about technology. Craig's especially interested in systems relating to e-commerce, automation, AI and Analytics.

CONTACT
+44 (0)20 8446 7555

[email protected]

SHARE


Copyright © 2023 JBI Training. All Rights Reserved.
JB International Training Ltd  -  Company Registration Number: 08458005
Registered Address: Wohl Enterprise Hub, 2B Redbourne Avenue, London, N3 2BS

Modern Slavery Statement & Corporate Policies | Terms & Conditions | Contact Us

POPULAR

Rust training course                                                                          React training course

Threat modelling training course   Python for data analysts training course

Power BI training course                                   Machine Learning training course

Spring Boot Microservices training course              Terraform training course

Kubernetes training course                                                            C++ training course

Power Automate training course                               Clean Code training course