
29 March 2023
Power BI is a powerful business analytics tool that allows users to extract insights from data in a variety of ways. In this comprehensive Power BI guide, we will explore some advanced techniques that can be used to take your Power BI skills to the next level. We will cover a variety of topics, including data modeling, DAX calculations, and custom visualizations.
Data Modeling:
Data modeling is the process of organizing data in a way that is optimized for analysis. Here are some advanced techniques for data modeling in Power BI:
Creating Relationships:
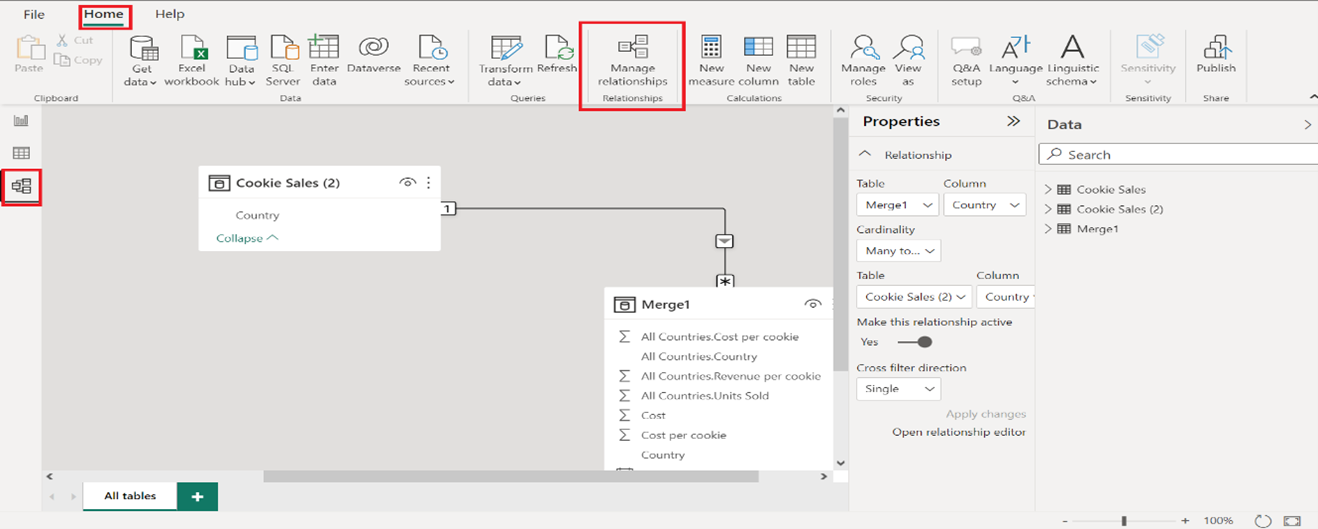
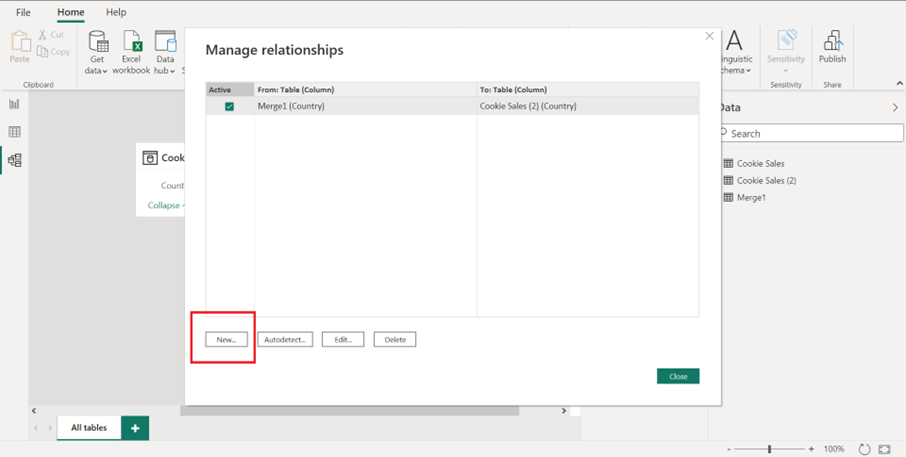
1. One of the key features of Power BI is the ability to create relationships between tables. To create a relationship, click on "Manage Relationships" in the Home tab. You can then select the tables you want to relate to and choose the fields to use as keys.
Using Many-to-Many Relationships:
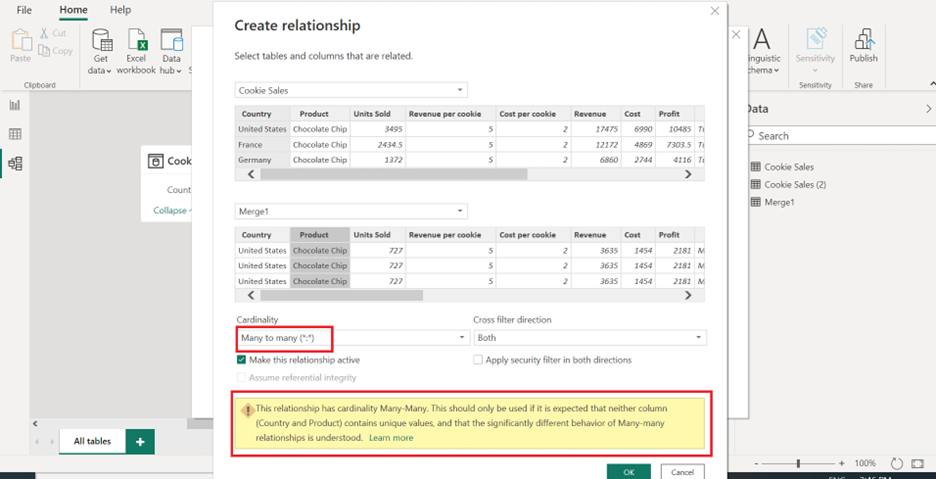
2. Sometimes, a many-to-many relationship is needed between tables. This can be accomplished using a bridge table. A bridge table is a table that contains keys from two or more other tables. This technique can be used to model complex relationships between tables.
DAX Calculations:
DAX is a formula language used to create custom calculations in Power BI. Here are some advanced DAX techniques:
Using FILTER:
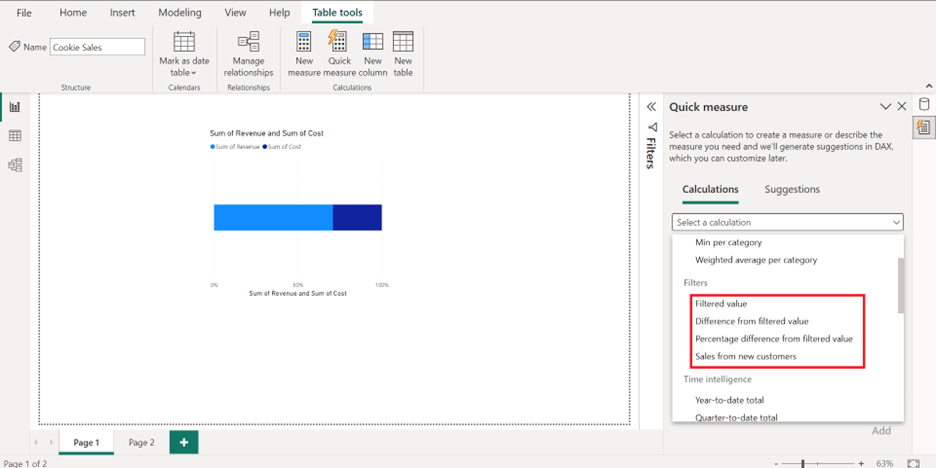
a. The FILTER function can be used to filter data based on specific criteria. For example, you can use FILTER to create a measure that calculates the revenue for a specific product category.
b. The CALCULATE function is used to modify the context of a calculation. It can be used to apply filters or to modify the calculation based on specific conditions.
The following example creates a report of Internet sales outside the United States by using a measure that filters out sales in the United States, and then slicing by calendar year and product categories. To create this measure, you filter the table, Internet Sales USD, by using Sales Territory, and then use the filtered table in a SUMX function.Using CALCULATE:
FILTER('InternetSales_USD', RELATED('SalesTerritory'[SalesTerritoryCountry])<>"United States")
Custom Visualizations:
Custom visualizations can be used to create unique and impactful reports and dashboards in Power BI. Here are some advanced techniques for creating custom visualizations:
Using Power BI Visuals SDK:
1. The Power BI Visuals SDK is a collection of tools and libraries used to build custom visuals. With this tool, you can create custom visuals that meet specific business needs.
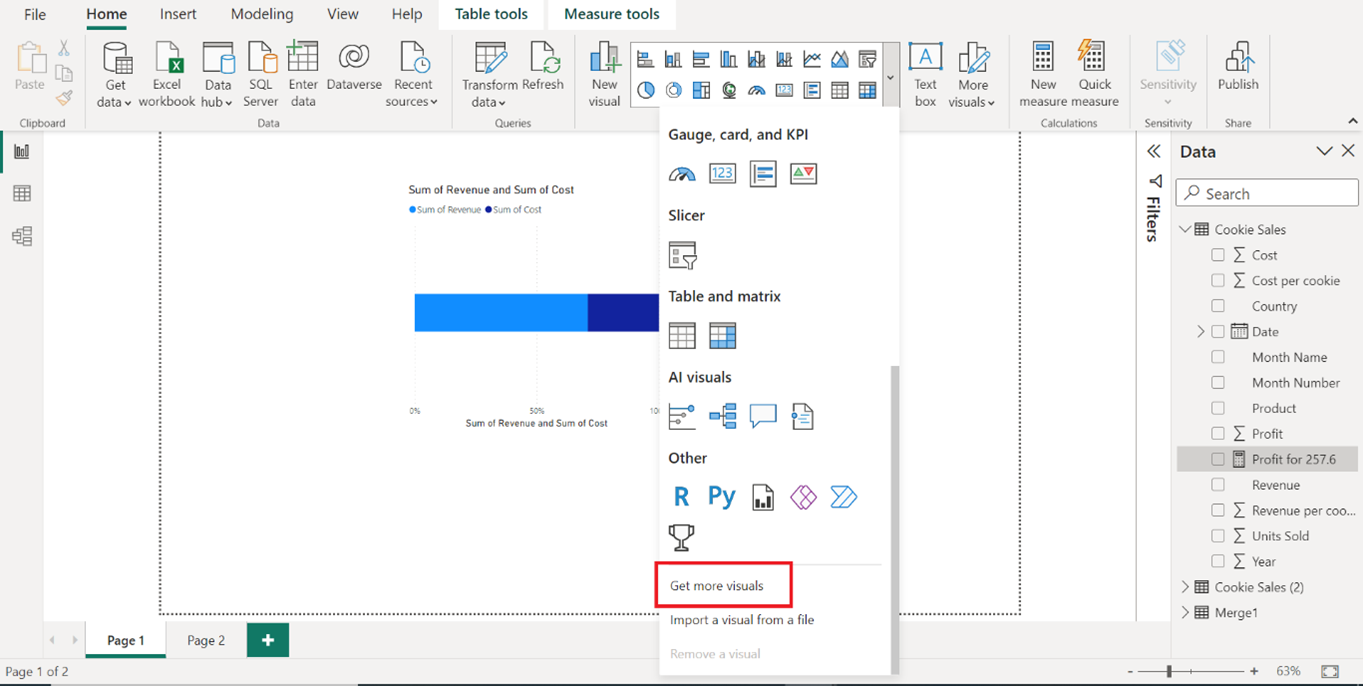
Using Custom Visuals Marketplace:
2. The Custom Visuals Marketplace is a collection of custom visuals created by the Power BI community. You can use these visuals to create unique and impactful reports and dashboards.
Conclusion:
Power BI is a powerful tool with a variety of features that can be used to extract insights from data. By utilizing advanced techniques like data modeling, DAX calculations, and custom visualizations, you can take your Power BI skills to the next level. Use the techniques and examples provided in this guide to get started with advanced Power BI today.
As you continue to explore the powerful features of Power BI, it's crucial to expand your knowledge and skills to take full advantage of its capabilities.
We highly recommend reading our next article, "How to perform a "group by" operation in Power BI while keeping all columns: a step-by-step guide" . In this step-by-step guide, we will explore a powerful data transformation technique in Power BI that allows you to group your data based on specific column(s) while retaining all original columns. This is particularly useful when you want to perform aggregations or analyze data at a higher level of detail without losing any associated information.

CONTACT
+44 (0)20 8446 7555

Copyright © 2023 JBI Training. All Rights Reserved.
JB International Training Ltd - Company Registration Number: 08458005
Registered Address: Wohl Enterprise Hub, 2B Redbourne Avenue, London, N3 2BS
Modern Slavery Statement & Corporate Policies | Terms & Conditions | Contact Us


