
29 March 2023
This article is brought to you by JBI Training, the UK's leading technology training provider. Please feel free to take a look at our other Power BI How-To Guides we have created for the community,
In Power BI, it is often necessary to customize the order of the X-axis in visuals to create meaningful and easy-to-understand reports. This comprehensive how-to guide will help you understand how to modify the X-axis order in Power BI in six simple stages. Each stage will provide step-by-step instructions, code examples, and use cases to help you better understand and apply the techniques.
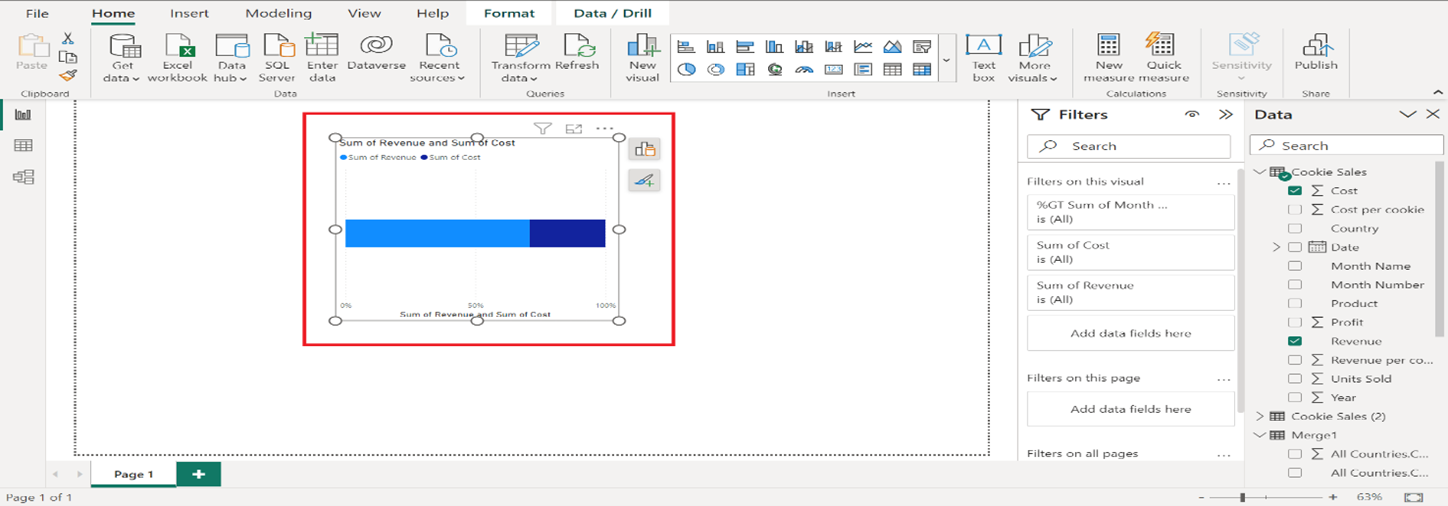
To begin, create a Power BI report and add a visual that has an X-axis:
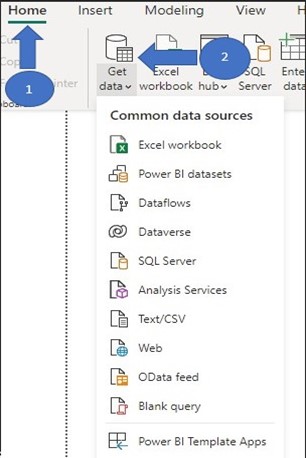
1. Open Power BI Desktop.
2. Click "Get Data" in the "Home" tab, and import the data you want to use for your visual.
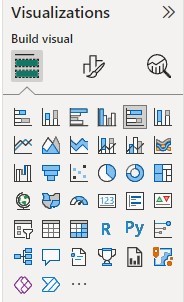
3. In the "Visualizations" pane, select the type of visual you want to create (e.g., bar chart, column chart, line chart).
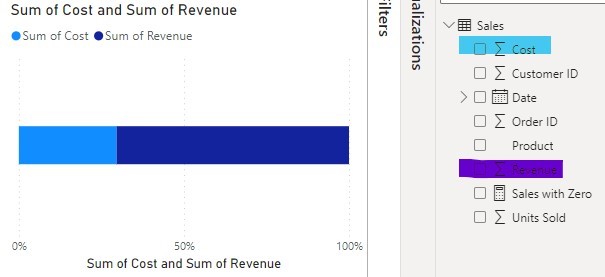
4. Drag and drop the fields from the "Fields" pane to the corresponding areas in the visual (e.g., Axis, Legend, Values).
Use case: Customize the X-axis order in a sales performance report to display sales by month in chronological order.
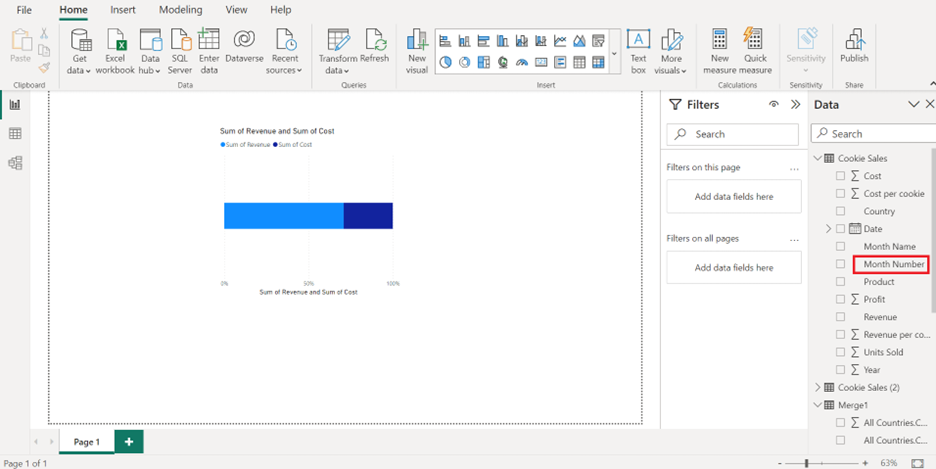
To customize the X-axis order, you first need to identify the field used for the X-axis in your visual. In the "Fields" pane, locate the field that you added to the "Axis" or "Legend" section of the visual.
For example, if you have a column chart displaying sales by month, the "Month" field will be used for the X-axis.
Use case: Determine which field to customize to achieve the desired X-axis order, such as sorting months chronologically or sorting categories by a specific metric.
If the default X-axis order doesn't meet your needs, you can sort the X-axis field by another column in your dataset. To do this, follow these steps:
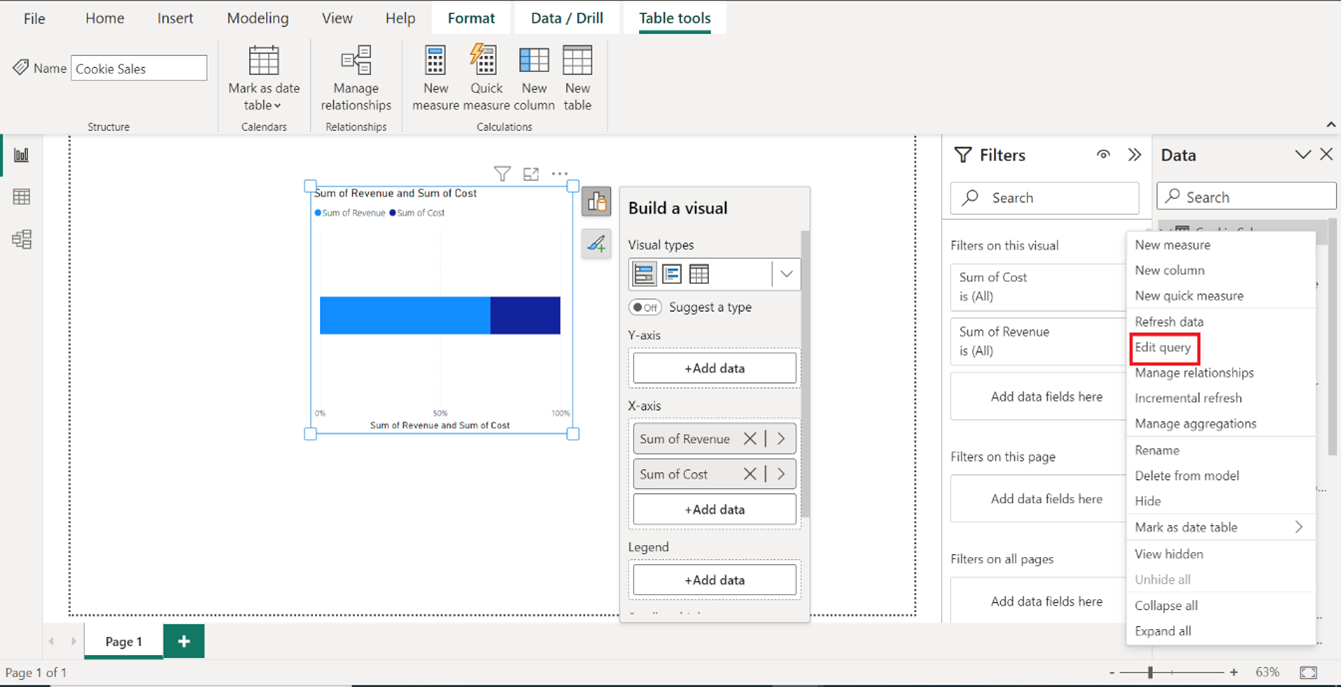
1. In the "Fields" pane, locate the table that contains the field used for the X-axis.
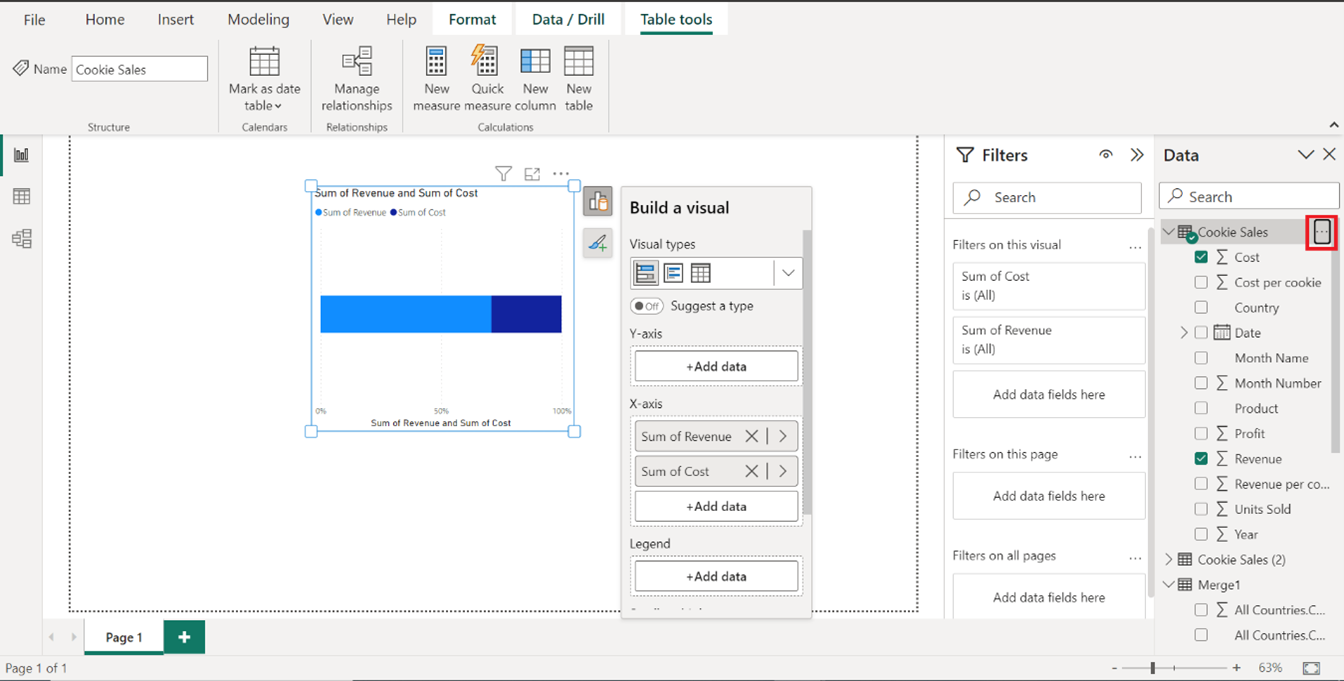
2. Click the ellipsis (...) next to the table name and choose "Edit Query" to open the Query Editor.
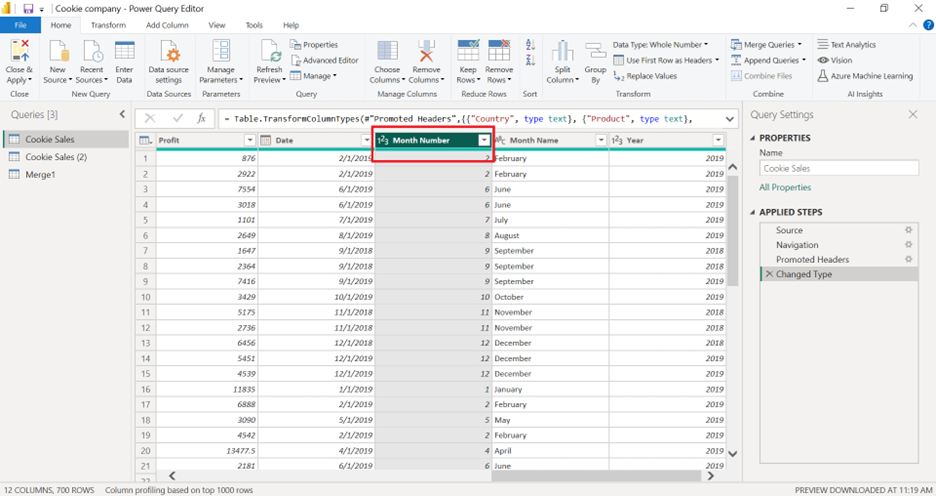
3. In the Query Editor, select the column you want to use for sorting the X-axis field (e.g., a numeric column representing the month order).
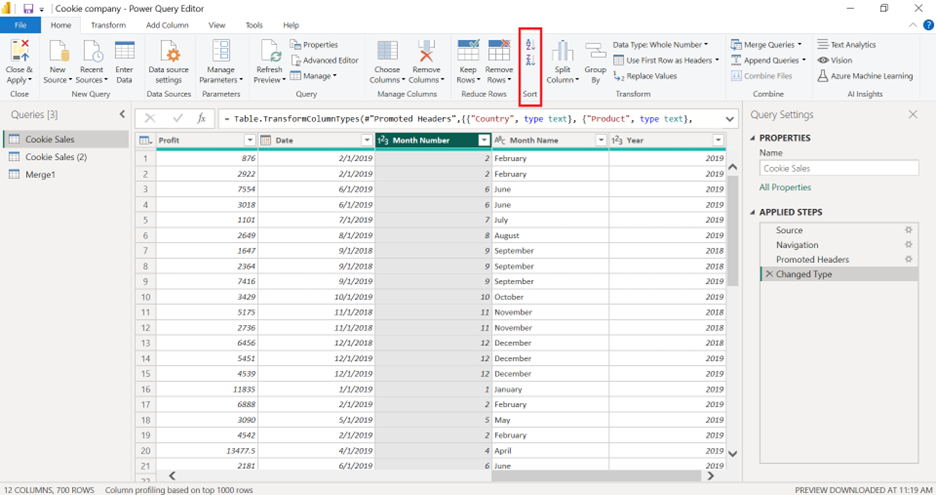
4. Go to the "Home" tab, click "Sort Ascending" or "Sort Descending" as needed.
5. Click "Close & Apply" to save your changes and return to the report view.
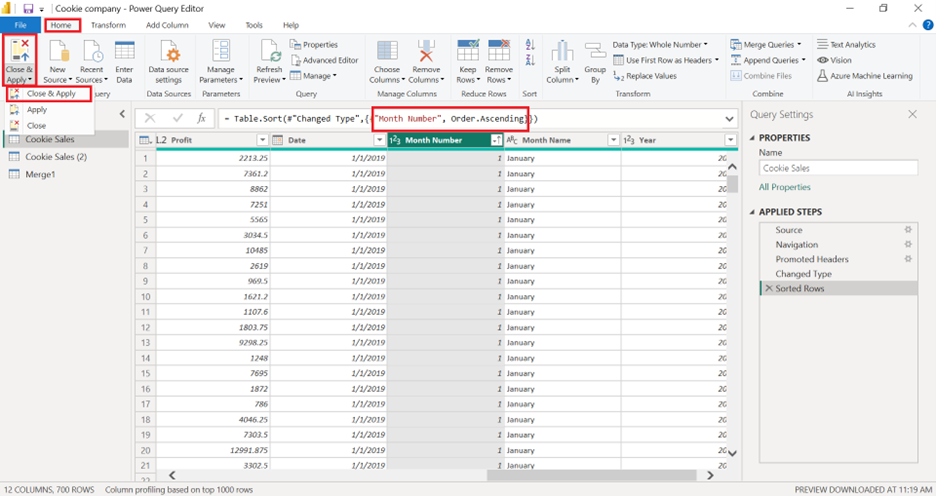
Use case: Sort a "Month" field by a numeric column representing the month's order (e.g., 1 for January, 2 for February) to display months in chronological order on the X-axis.
After sorting the X-axis field by another column in the Query Editor, apply the custom sort order to the field in the report view. Follow these steps:
1. In the "Fields" pane, locate the field used for the X-axis.
2. Click the ellipsis (...) next to the field name, and choose "Sort by Column."
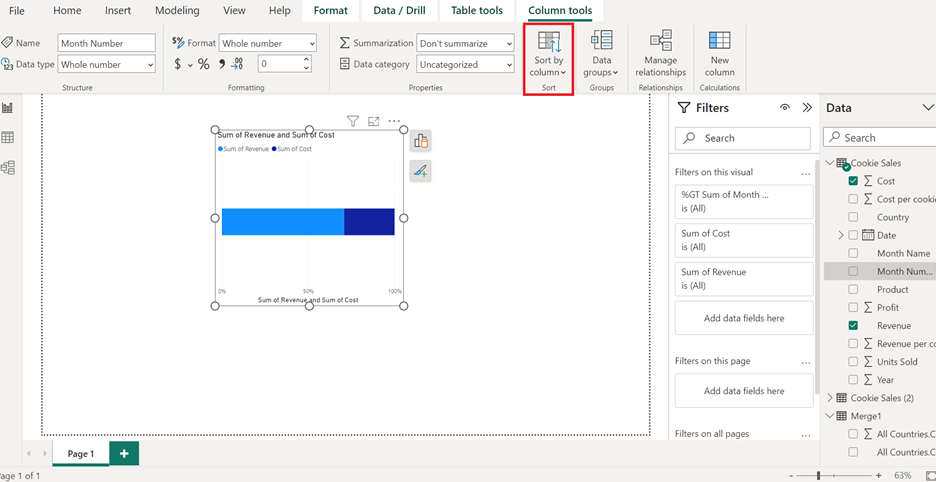
3. In the "Sort by Column" dropdown, select the column you used for sorting the X-axis field in the Query Editor (e.g., the numeric column representing the month order).
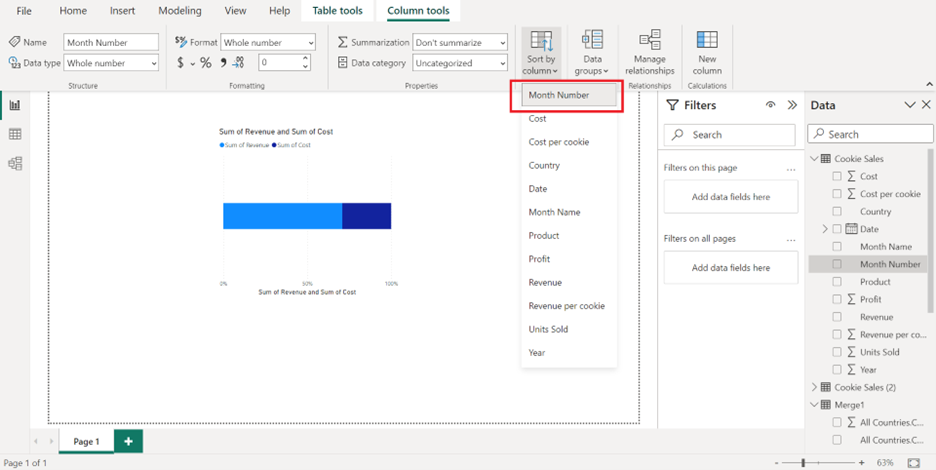
The visual's X-axis will update to reflect the custom sort order based on the selected column.
Use case: Apply a custom sort order to the X-axis field to display data in a more meaningful and logical sequence, such as sorting products by revenue or displaying months chronologically.
To further improve the X-axis appearance, you can modify the formatting:
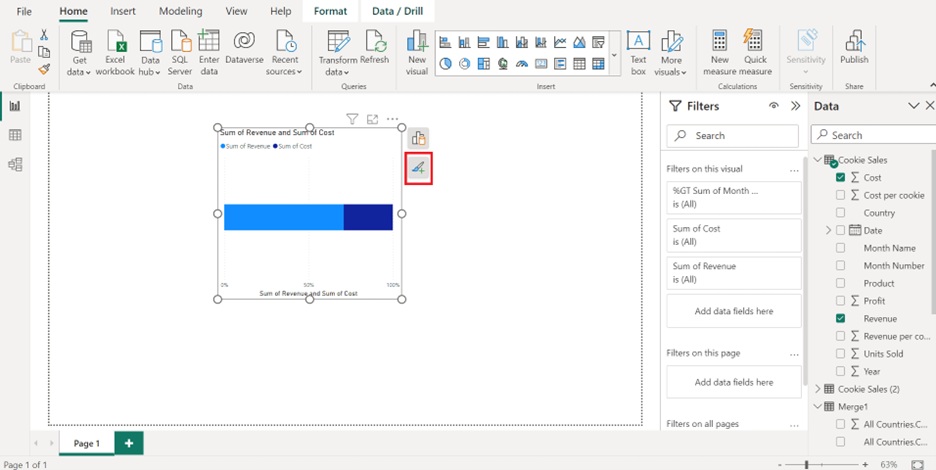
1. Click on the visual to select it.
2. In the "Visualizations" pane, click on the "Format" tab (the paint roller icon).
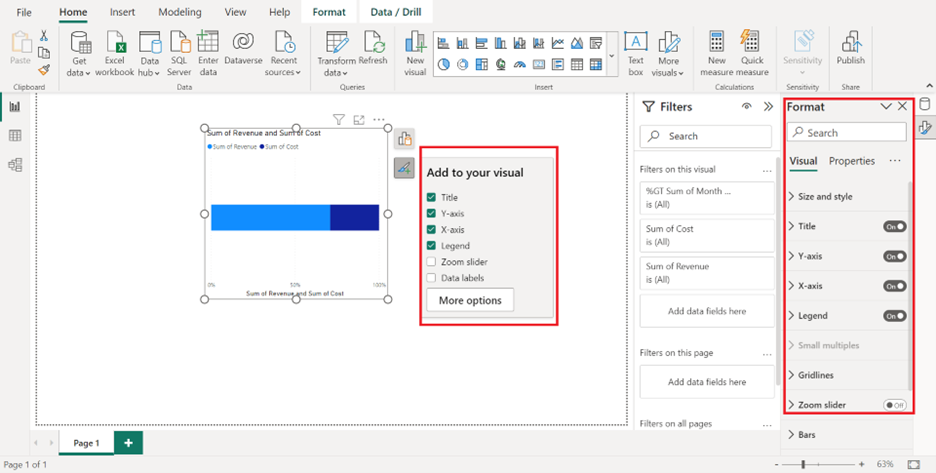
3. Expand the "X-Axis" section to access various formatting options, such as title, labels, and axis scale.
4. Adjust the formatting settings as needed to improve the clarity and readability of the X-axis.
Use case: Enhance the X-axis formatting to make it easier for users to understand the data, such as changing the font size, adding a title, or adjusting the axis scale.
After customizing the X-axis order and formatting, review the visual to ensure it meets your requirements. If necessary, make further adjustments to the sorting or formatting until the visual effectively communicates the desired insights.
Remember to save your Power BI report periodically to avoid losing any changes.
Use case: Continuously review and iterate the custom X-axis order to ensure the visual effectively communicate key insights, such as trends, comparisons, or performance metrics.
By following the six stages in this comprehensive how-to guide, you can customize the X-axis order in Power BI to create more meaningful and insightful visuals. Mastering the techniques for custom sorting and formatting the X-axis will enable you to display data in a logical sequence, making it easier for users to understand and interpret the information presented in your reports. Keep iterating and fine-tuning the X-axis order and formatting to achieve the desired level of clarity and readability in your visuals.
As you continue to explore the powerful features of Power BI, it's crucial to expand your knowledge and skills to take full advantage of its capabilities.
We highly recommend reading our next article, "Using Group By in Power Query while Retaining All Columns - A How-To Guide" where we talk about Power Query in Power BI to clean and transform your data.

CONTACT
+44 (0)20 8446 7555

Copyright © 2023 JBI Training. All Rights Reserved.
JB International Training Ltd - Company Registration Number: 08458005
Registered Address: Wohl Enterprise Hub, 2B Redbourne Avenue, London, N3 2BS
Modern Slavery Statement & Corporate Policies | Terms & Conditions | Contact Us


