
6 July 2023
Power BI is an incredibly useful tool for visualising and exploring data in a captivating and interactive manner.
One of the standout features Of Power BI is the ability to create diverse types of charts, including scatter charts.
Scatter charts are perfect for analysing the relationship between two numerical variables and identifying patterns or correlations within the data.
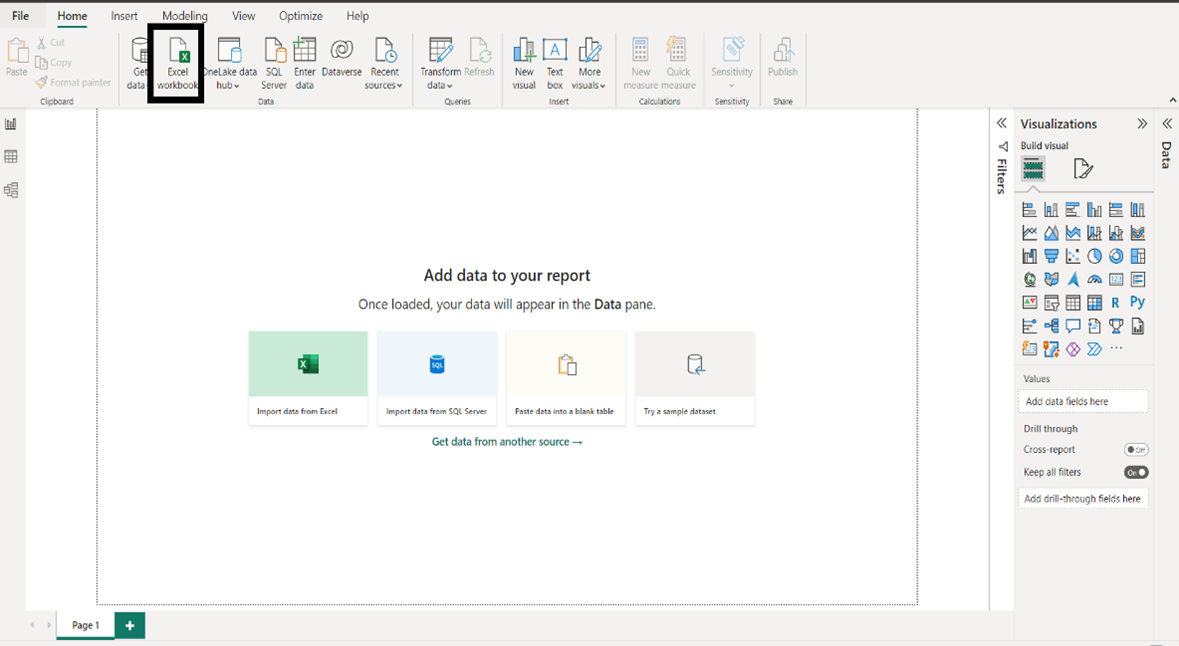
In this Power BI How-to guide, we'll take you through the process of creating a scatter chart in Power BI using Excel data as our data source. You'll learn how to connect your dataset to Power BI, select the relevant data fields, and customize the chart to effectively visualise your data.
By following the step-by-step instructions provided in this guide, you'll gain a solid understanding of how to create and tailor scatter charts in Power BI.
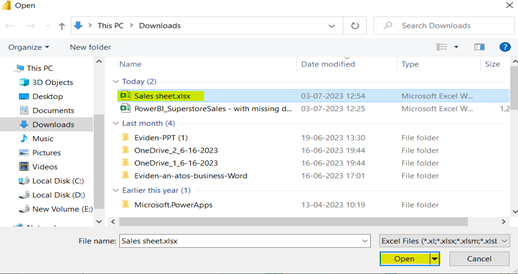
Remember, we are using Excel data for creating a scatter chart.
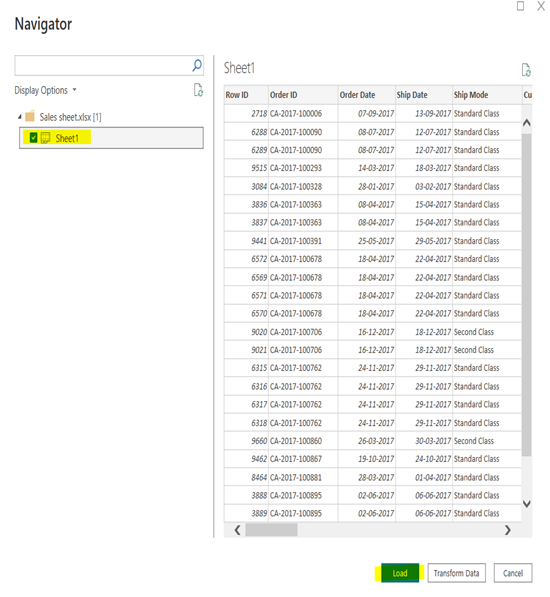
Now, a Navigator window will pop up on your screen. It displays an overview of the data so you can be sure that the range of the data is correct. Now you can load the data by following the below step.
Once the data source is loaded successfully, we can create our Scatter Chart using the data fields.
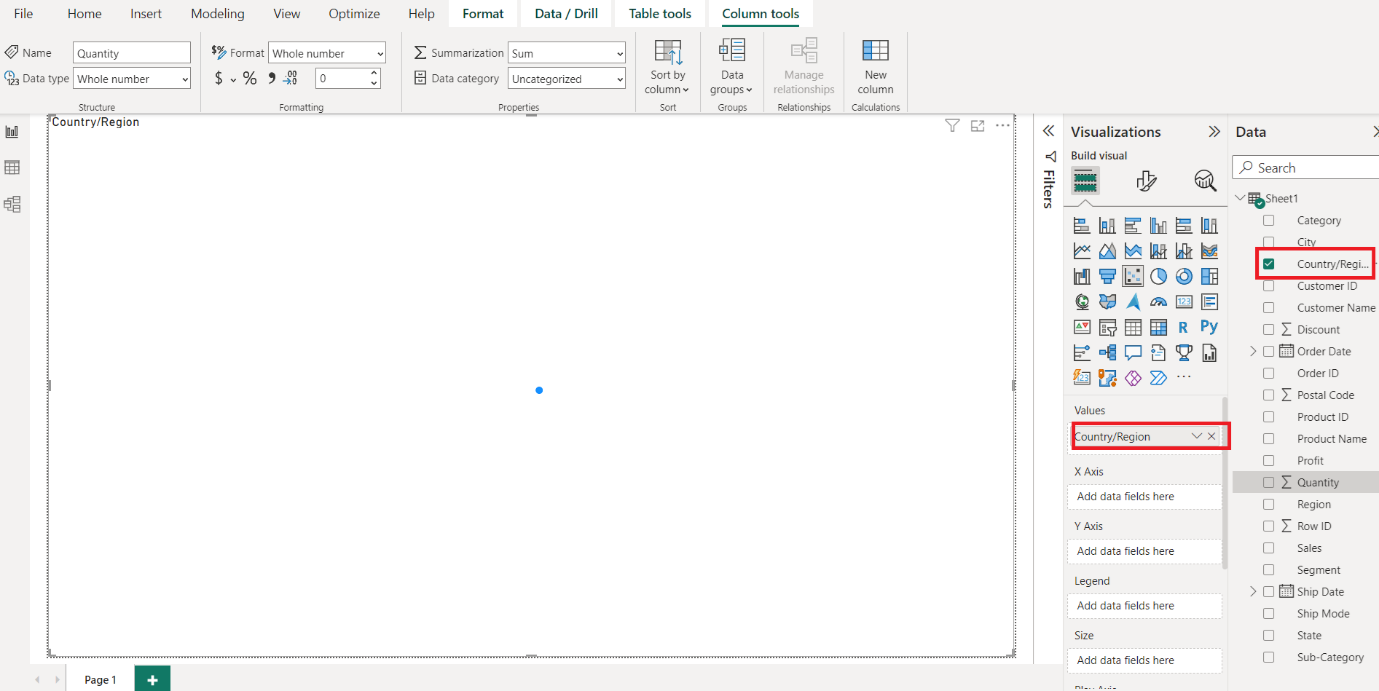
First, click on the Scatter Chart under the Visualization section. It automatically creates a Scatter Chart
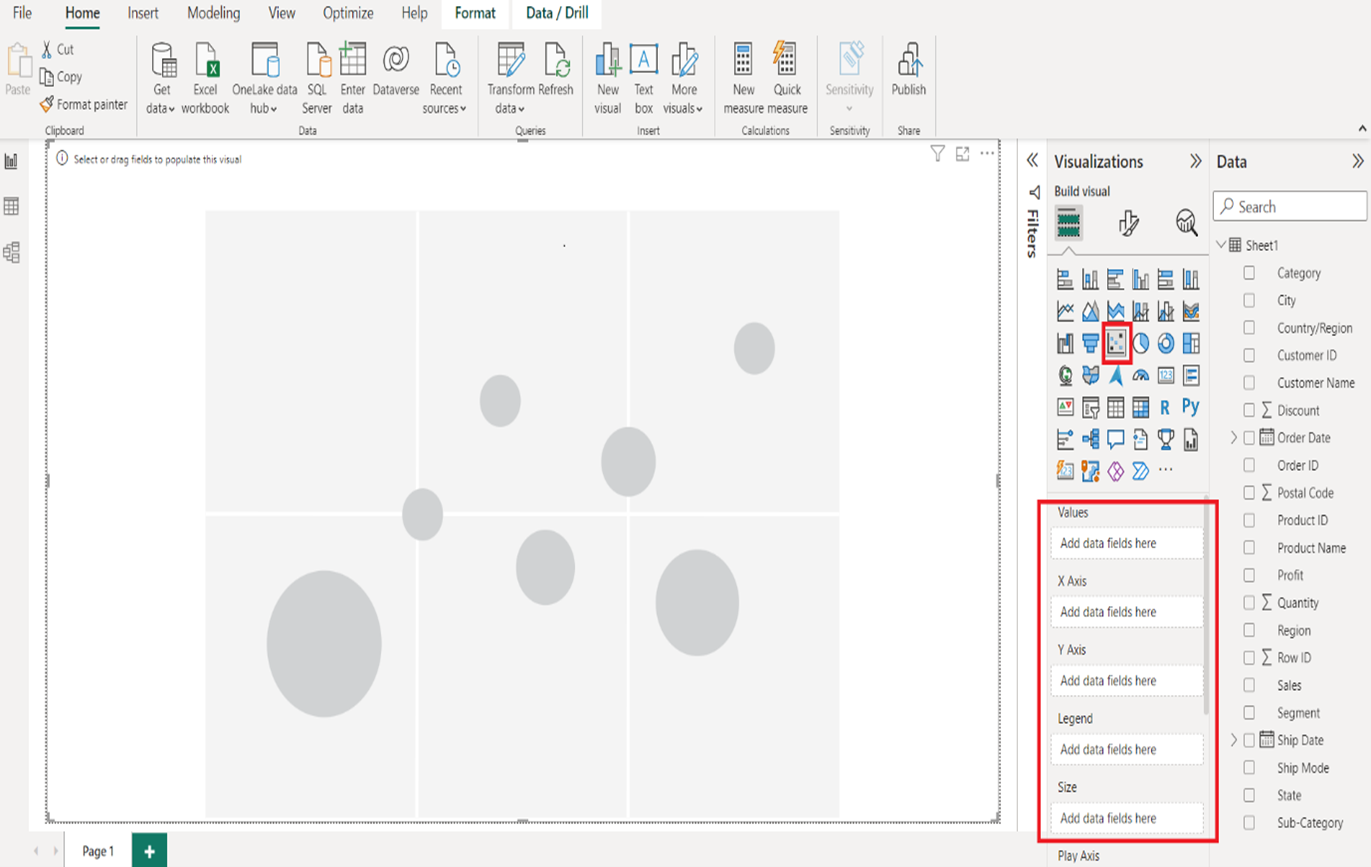
To add data to the Power BI Scatter Chart, we must add the required fields:
Next, we must add the English Country/Region to the Values section. You can do this by dragging Country to the Details section, or simply checkmark the Country/Region column.
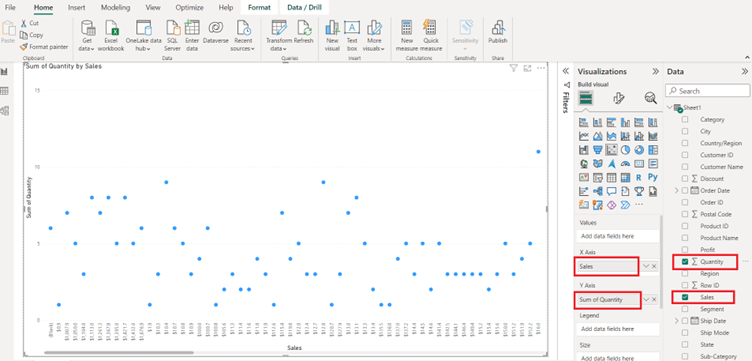
Drag the Sales Amount from the Fields section to the X-Axis section, and Order Quantity to Y-Axis Section.
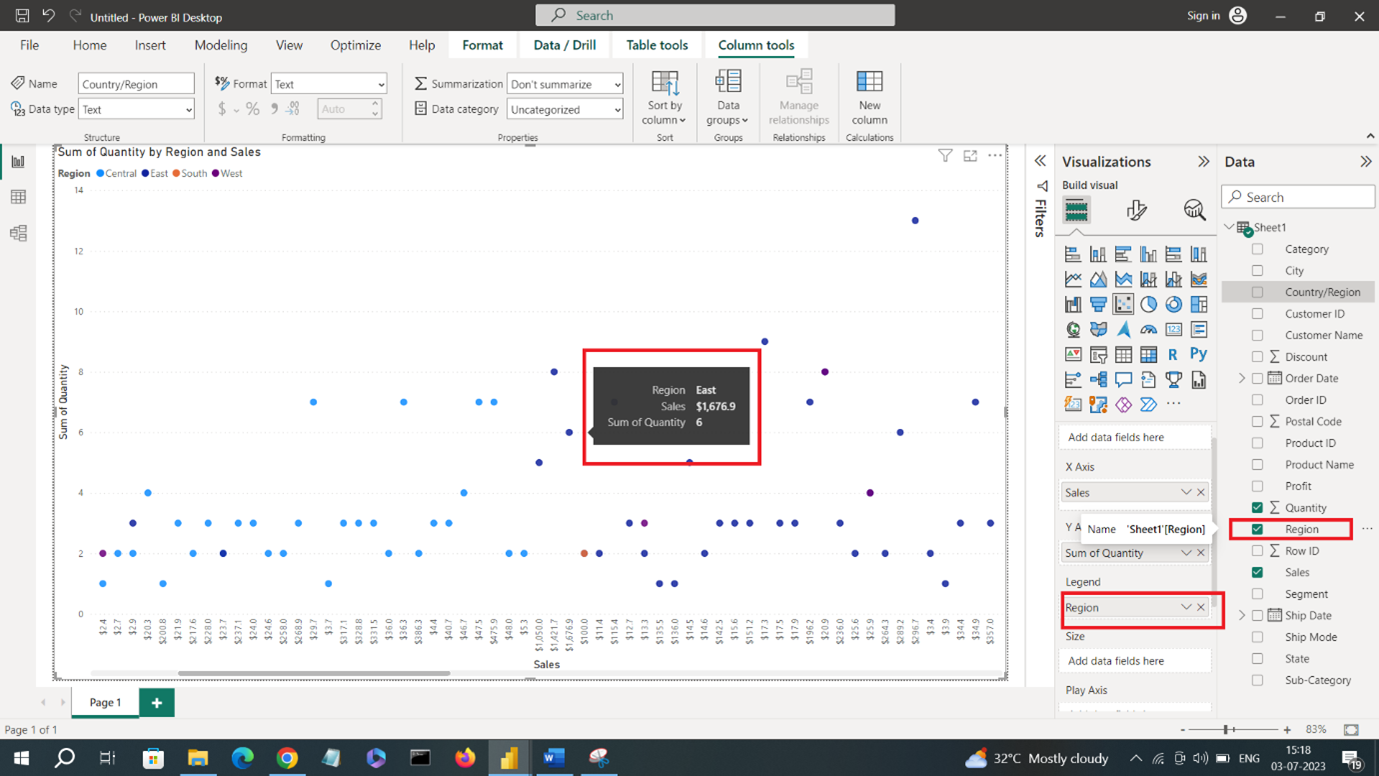
Next, we need to add Region to the Legend section. Hovering over one of these circles will show information about the Region, Sales, and Total Production Cost.
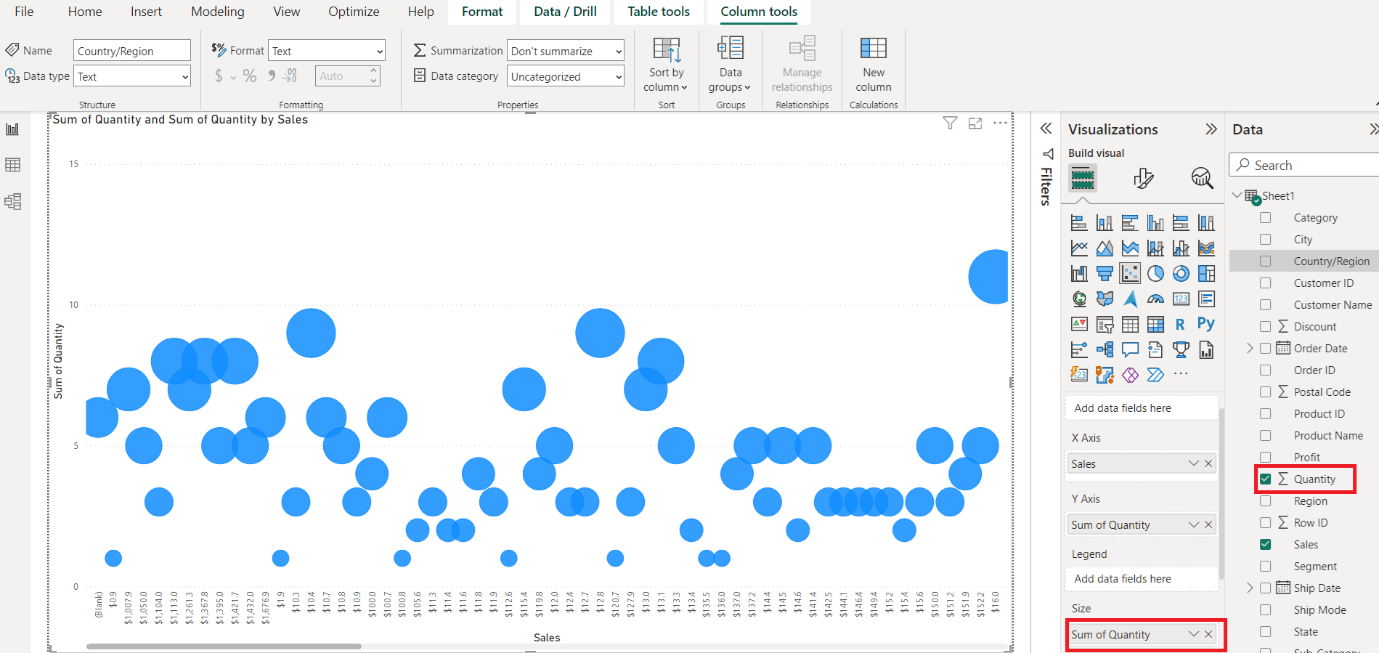
To demonstrate the Size section of a Power BI scatter chart, we removed the Region from the Legend section and added the Quantity to the Size section.
As you can see from the screenshot below, the circle size has changed as per Quantity.
If you enjoyed reading this Power BI Scatter Graph guide, you may also find our how to guide on Mastering M Scripting Language in Power BI: A Comprehensive Guide, and Power BI: Connecting Power BI to SQL Server. Thanks for stopping by!
CONTACT
+44 (0)20 8446 7555

Copyright © 2023 JBI Training. All Rights Reserved.
JB International Training Ltd - Company Registration Number: 08458005
Registered Address: Wohl Enterprise Hub, 2B Redbourne Avenue, London, N3 2BS
Modern Slavery Statement & Corporate Policies | Terms & Conditions | Contact Us


