
24 March 2023
In this step-by-step guide, we will explore a powerful data transformation technique in Power BI that allows you to group your data based on specific column(s) while retaining all original columns. This is particularly useful when you want to perform aggregations or analyze data at a higher level of detail without losing any associated information. This is one article from our Power BI tutorials guide.
By following this guide, you will learn how to utilize Power Query Editor, both through the graphical user interface and by writing custom M language code, to achieve this "group by" operation while keeping all columns intact. This tutorial is designed for users with various levels of experience in Power BI, so whether you are a beginner or an advanced user, you will find valuable insights and techniques to enhance your data analysis capabilities.
Here's a step-by-step guide on how to use the "group by" function while keeping all columns:
Load your data into Power BI:
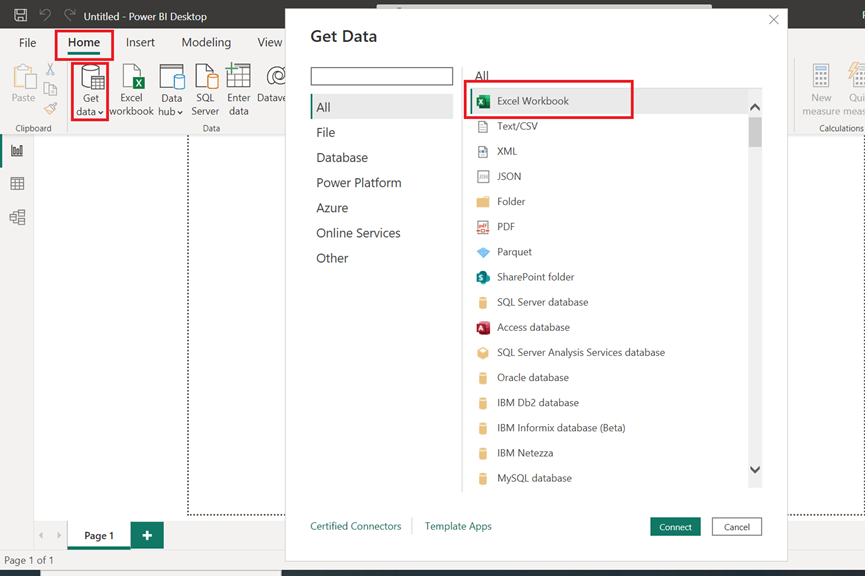
1. Click on "Home" > "Get Data" > "Excel" (or any other data source you have). Navigate to your data file and click "Open." Once you've loaded your data, you'll see it in the "Fields" pane.
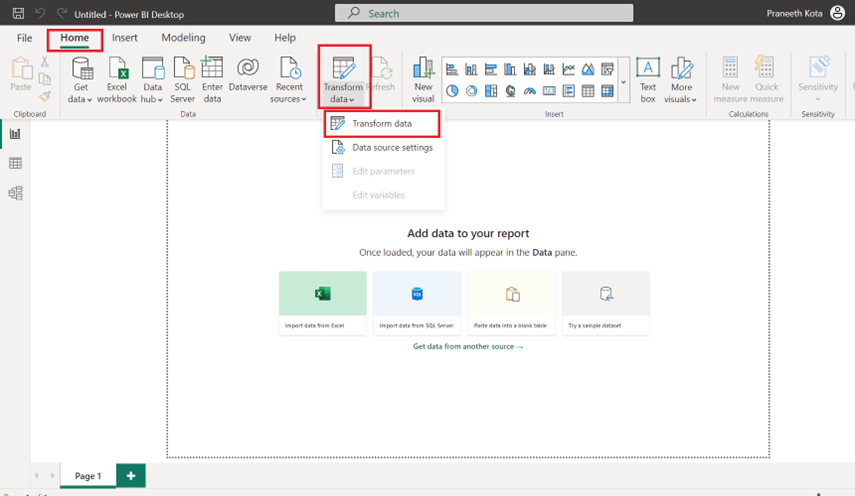
2. To open the Power Query Editor, click on "Home" > "Transform Data" > "Transform Data" again.
Duplicate your table:
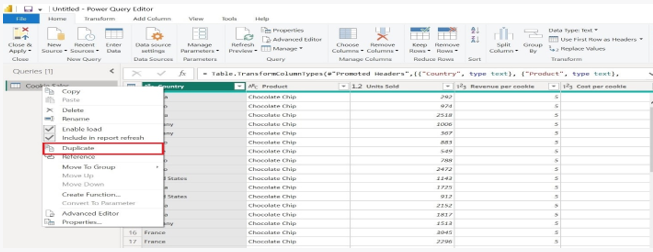
3. In the Power Query Editor, right-click on the table you want to group and select "Duplicate." We'll use this duplicate table to create the grouping and then merge it back with the original table.
Group your data in the duplicate table:
4. Click on the duplicate table. Then, select the column you want to group by. Click on "Group By" in the "Home" tab.
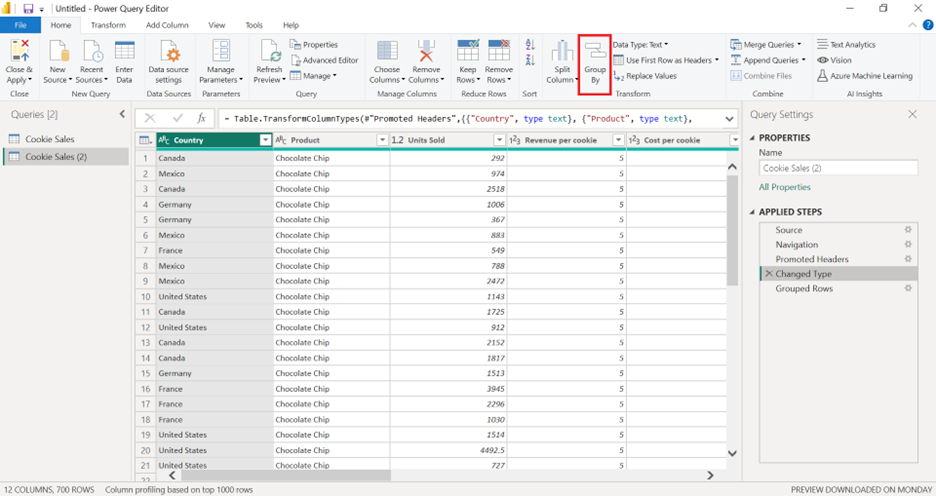
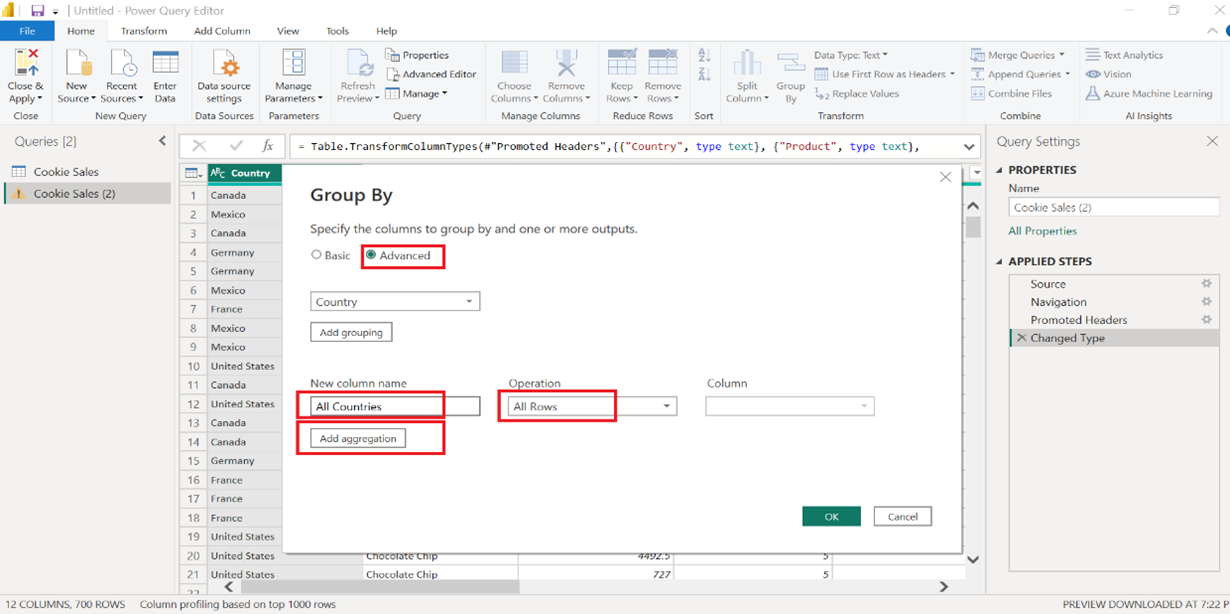
5. In the "Group By" window, choose the "Advanced" option.Add a new aggregation by clicking on the "+" button. Set the "Operation" to "All Rows" and provide a name for the new column (e.g., "All countries"). Click "OK" to apply the grouping.
Merge the original table with the duplicate table.
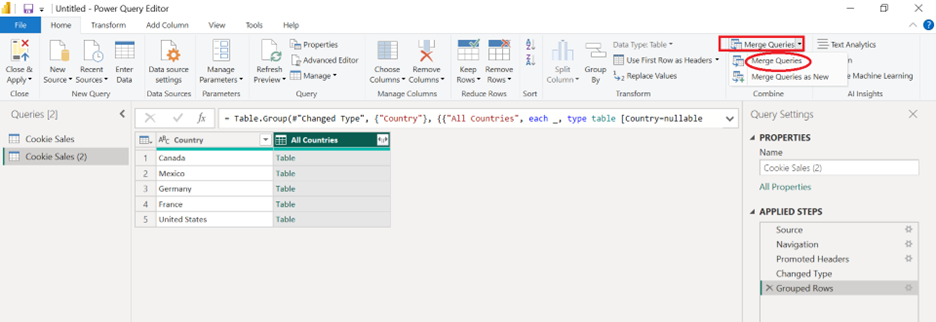
6. Click on the original table. Then, navigate to "Home" > "Merge Queries" > "Merge Queries as New.
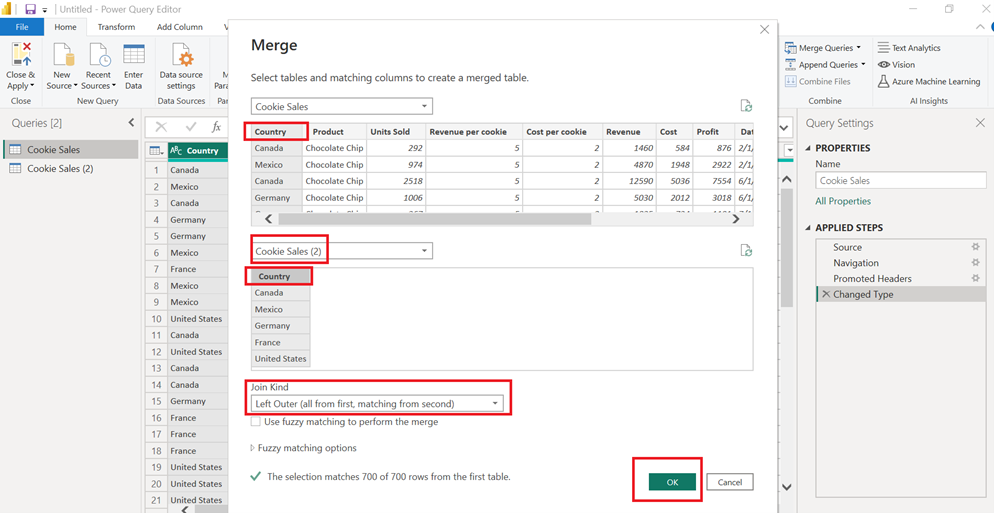
7. In the "Merge" window, select the duplicate table as the second table, and choose the columns you grouped by in both tables as the matching columns. Make sure the "Join Kind" is set to "Left Outer" to keep all rows from the original table. Click "OK."
Expand the "All countries" column:
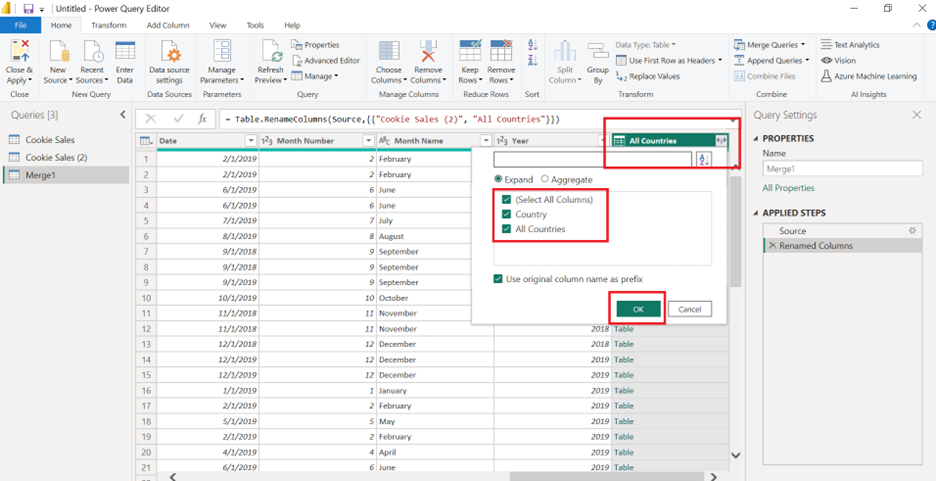
8. In the new merged table, click on the "Expand" button (two arrows) in the "All Countries" column header. Select all columns you want to keep from the grouped table. Click "OK."
Remove duplicate rows (optional):
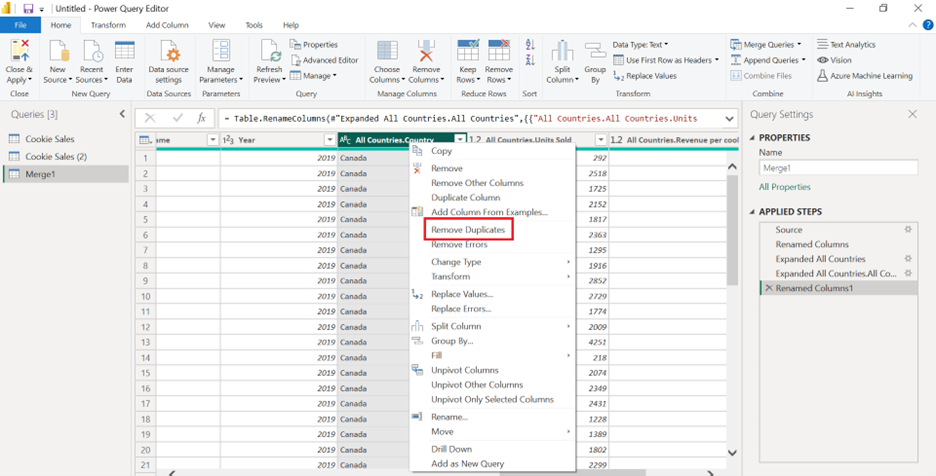
9. If your original table had multiple rows with the same values in the grouped columns, you might have duplicate rows after merging. To remove duplicates, select all columns, right-click on one of the column headers, and choose "Remove Duplicates."
Apply changes and close Power Query Editor:
10 . Click on "Home" > "Close & Apply" to apply the transformations and return to the main Power BI window.
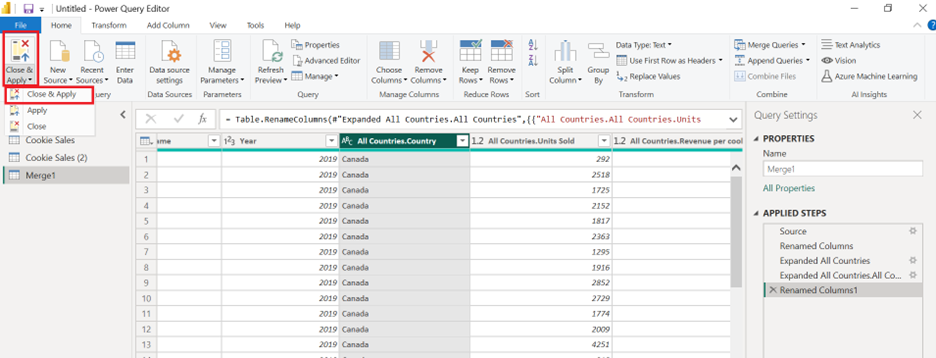
Now you have a table that is grouped by your chosen column(s) while keeping all the original columns.
Code Examples
While the previous explanation was using the Power Query GUI, we can achieve the same result using the M language (Power Query's formula language) to write custom code. Here's an example of the code you can use to perform a "group by" operation while keeping all columns:
1. Load your data into Power BI, open Power Query Editor, and select your table as mentioned in the previous steps.
2. Click on "Advanced Editor" in the "Home" tab. You'll see a script similar to the following:

3. Add the following lines of code to perform the "group by" operation while keeping all columns. Replace "Column1" with the column you want to group by:

4. Replace the last line of the script (#"Changed Type") with ExpandedTable to use the result of the operation as the output:

5. Click "Done" to apply the code and close the Advanced Editor.
6. Apply the changes and close Power Query Editor as mentioned before.
Now you have the same result as before but using custom code instead of the Power Query GUI. The code first groups the data, then performs a left outer join to merge the original table with the grouped data, and finally expands the grouped data column to display all columns.
Now you have the same result as before but using custom code instead of the Power Query GUI.
The code first groups the data then performs a left outer join to merge the original table with the grouped data and finally expands the grouped data column to display all columns.
In conclusion, we hope you found this step-by-step guide on performing a "Group By" operation while keeping all columns in Power BI insightful and valuable.
As you continue to explore the powerful features of Power BI, it's crucial to expand your knowledge and skills to take full advantage of its capabilities.
We highly recommend reading our next article, "Mastering Data Modeling DAX Calculations and Custom Visualizations". We explore some advanced techniques that can be used to take your Power BI skills to the next level. We will cover a variety of topics, including data modeling, DAX calculations, and custom visualizations.

CONTACT
+44 (0)20 8446 7555
Copyright © 2025 JBI Training. All Rights Reserved.
JB International Training Ltd - Company Registration Number: 08458005
Registered Address: Wohl Enterprise Hub, 2B Redbourne Avenue, London, N3 2BS
Modern Slavery Statement & Corporate Policies | Terms & Conditions | Contact Us
POPULAR
AI training courses CoPilot training course
Threat modelling training course Python for data analysts training course
Power BI training course Machine Learning training course
Spring Boot Microservices training course Terraform training course